Japanese Learning Answer Dataset — August 2026
In one line: aggregate statistics from 56,613 anonymous answer events on Nihongo to Japan, contributed by 1,053 anonymous learner identifiers across 11,987 questions.
⚠️ This is an August 2026 snapshot, not a study of the whole of 2026. The data covers 2–13 August 2026, twelve days in total (the aggregation pipeline went live on 2 August; the first day is partial). No longitudinal trend can be read from it. Version 1.1.0, snapshot frozen 2026-08-14.
On "learner identifiers": these are anonymous identifiers generated at random in the browser and cannot be merged across devices. One person using a phone and a laptop produces two identifiers, so 1,053 is not a verified count of distinct people — it is an upper bound. This page says "learner identifiers" throughout rather than "people".
What this is not. This is not a representative survey of Japanese learners in Taiwan or anywhere else. The sample consists of people who chose to practise on this site — a self-selected, observational sample. Every figure describes what happened in this set of answers, and cannot be extrapolated to any population. See Limitations.
Ten findings you can quote directly
Each item below is self-contained: the sentence itself carries the dataset name, the snapshot window, the sample size and the confidence interval, so a journalist or researcher can copy any single item without going back for context. Every figure is an observed value within this dataset (the primary analysis set is quiz-context first attempts — see Methodology), not an inference about the population of Japanese learners, and no causal claim is made. Please cite the Limitations alongside the figures.
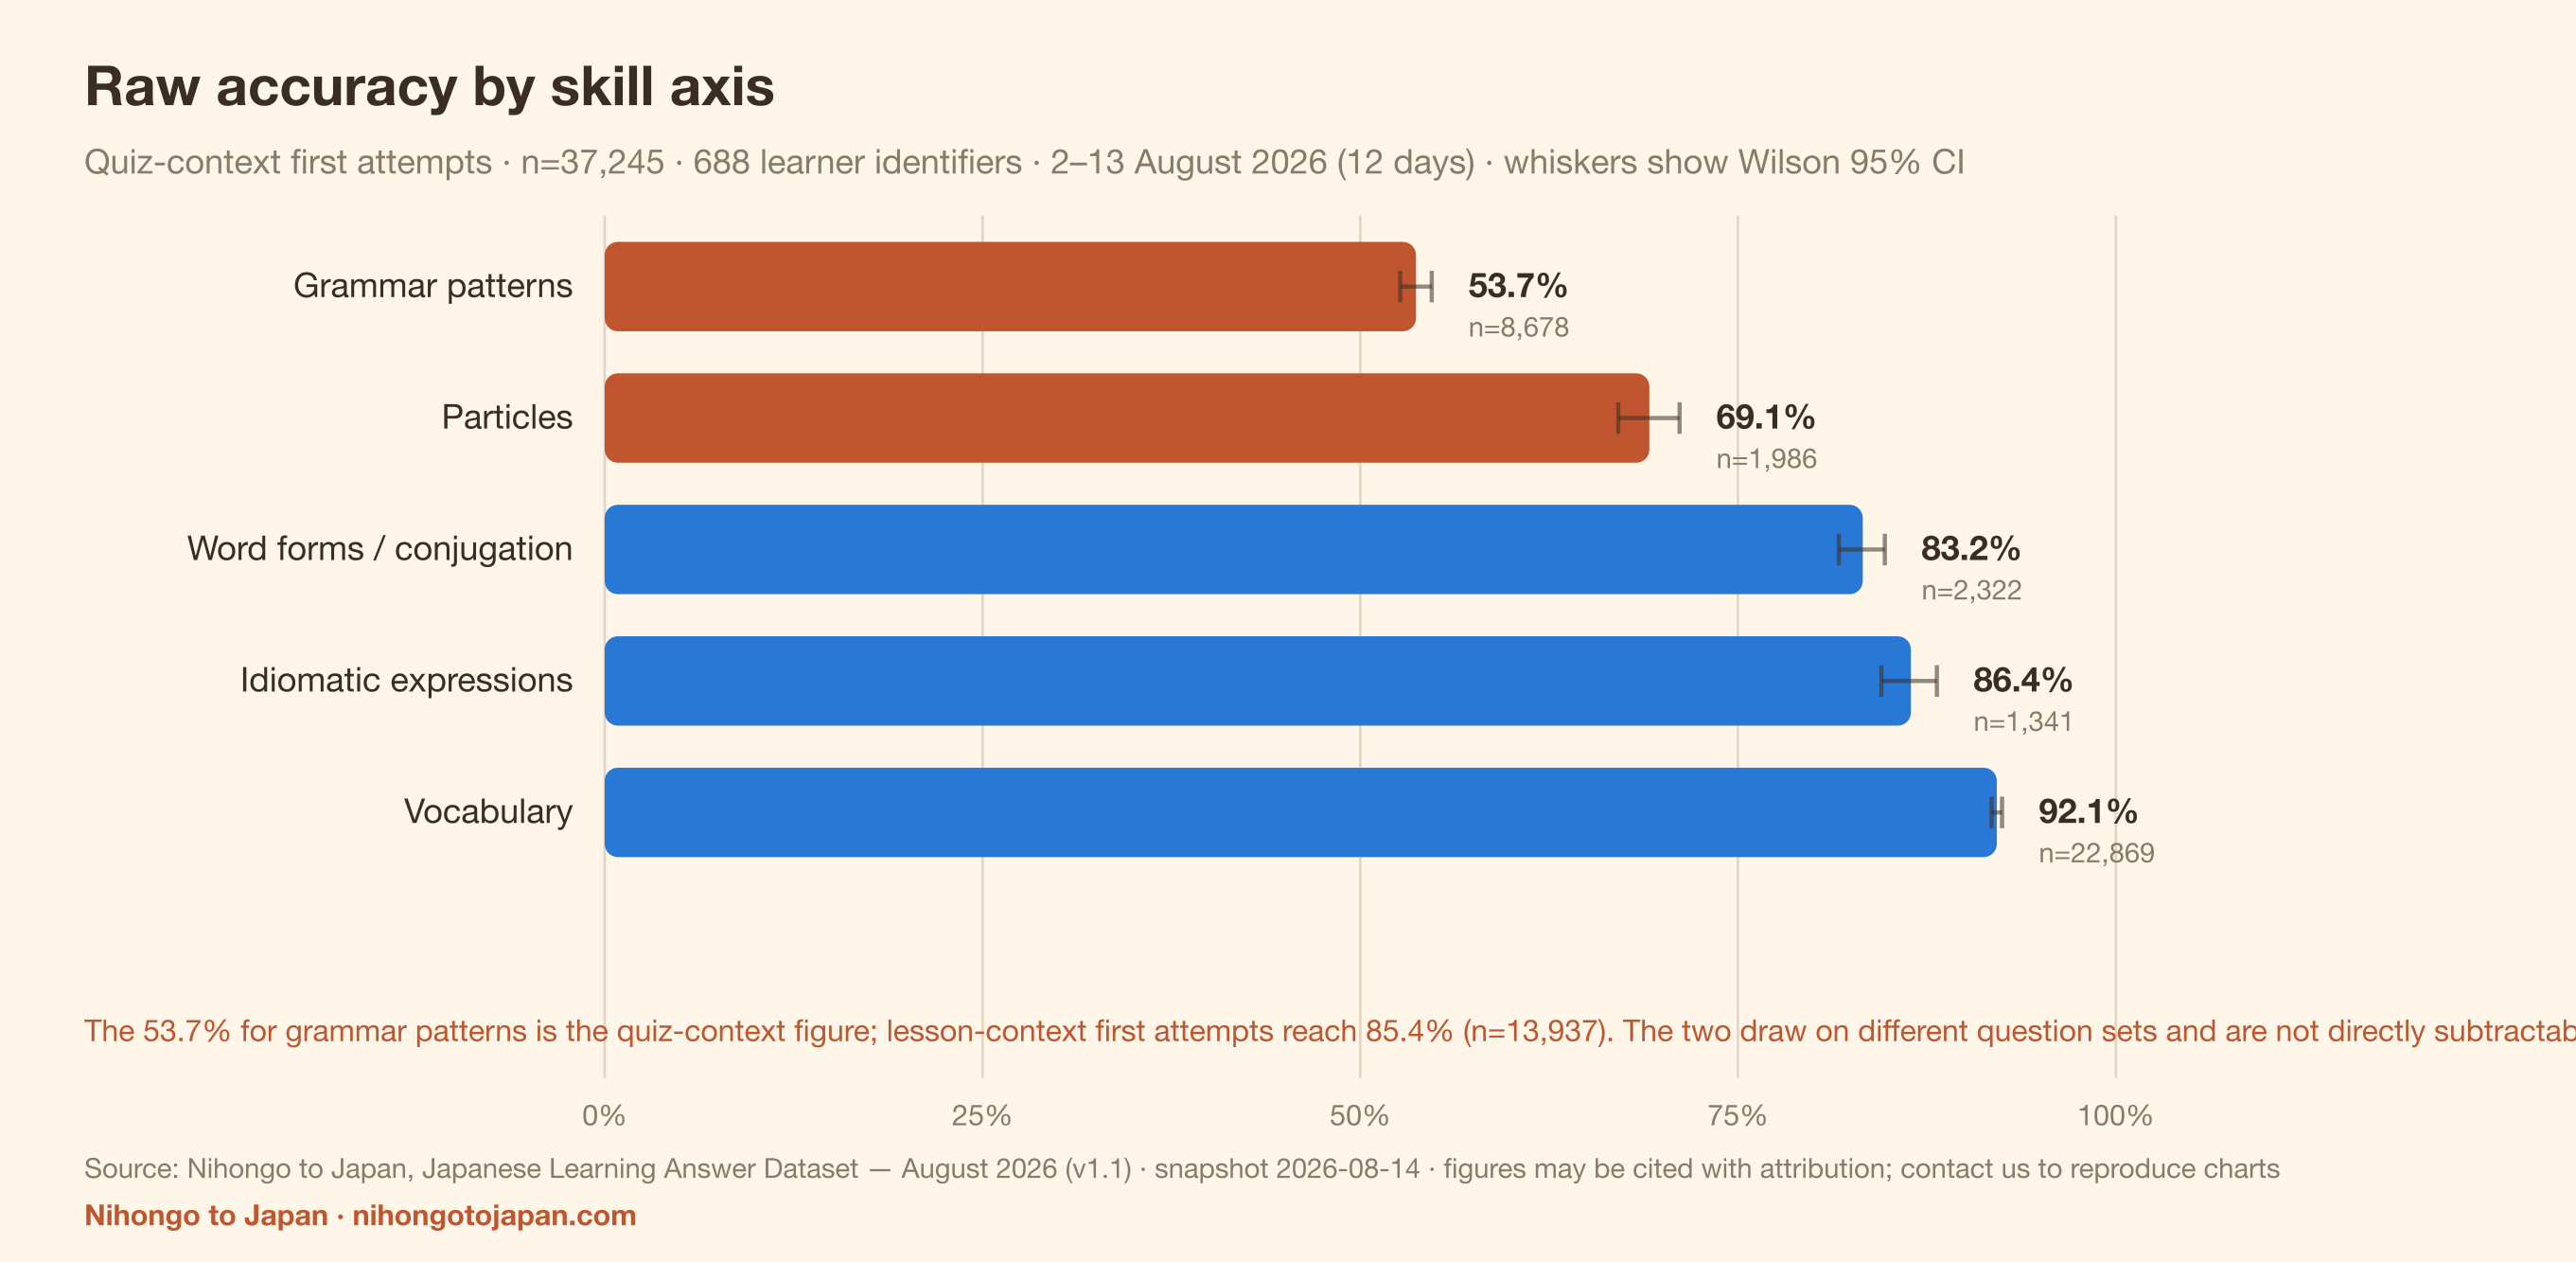
- In quiz-context first attempts in the NTJ Japanese Learning Answer Dataset (August 2026 snapshot, 12 days), grammar-pattern questions were answered correctly 53.7% of the time (n=8,678; Wilson 95% CI 52.6%–54.7%), compared with 92.1% for vocabulary (n=22,869; 95% CI 91.8%–92.5%) — a gap of 38 percentage points.
The two intervals do not overlap, so the gap is not sampling noise; this report makes no claim about the cause. - In quiz-context first attempts in the same dataset, the five learning axes rank from lowest to highest as follows: grammar patterns 53.7% (n=8,678), particles 69.1% (n=1,986; 95% CI 67.1%–71.1%), word forms and conjugation 83.2% (n=2,322; 95% CI 81.7%–84.7%), idiomatic expressions 86.4% (n=1,341; 95% CI 84.5%–88.2%) and vocabulary 92.1% (n=22,869).
Each axis draws on a different question set, so this is an ordering of observed accuracy, not an ordering of difficulty. - In the same dataset, observed accuracy on the grammar-pattern axis ranges from 53.7% to 85.4% depending on which answers are included: 53.7% in quiz-context first attempts (n=8,678), 85.4% in lesson-context first attempts (n=13,937) and 74.1% across all answer events (n=24,293).
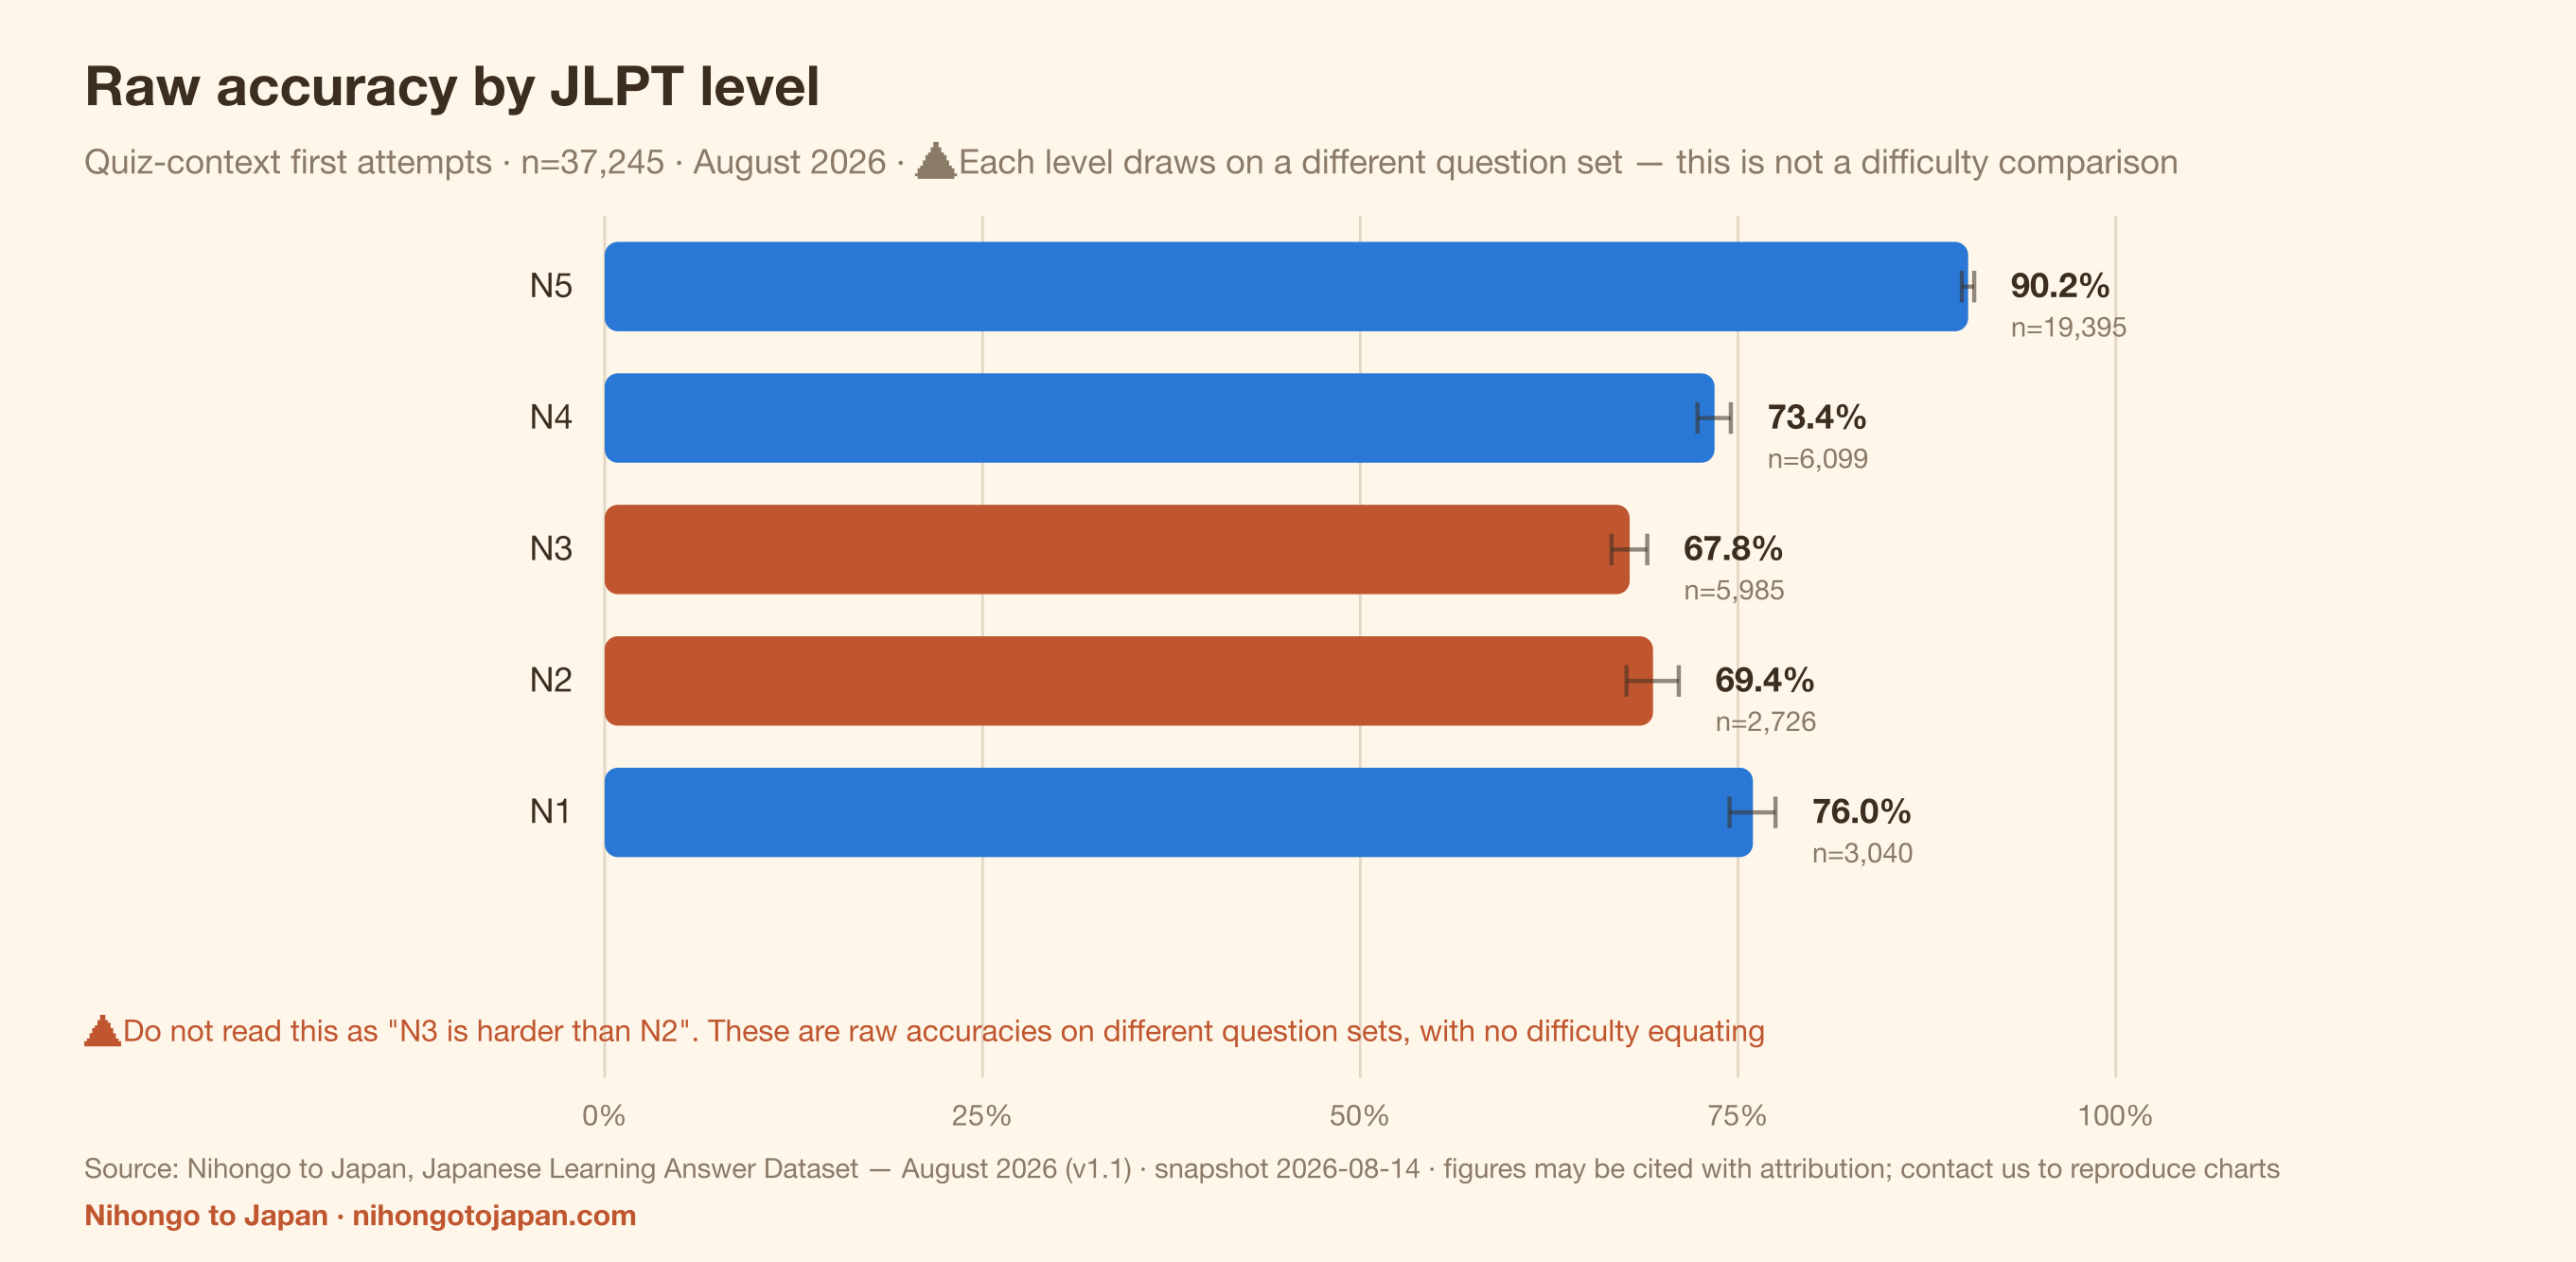
The two contexts draw on almost disjoint question sets — only 6 of 5,772 distinct grammar-pattern questions appear in both — so the context effect cannot be separated from differences in question difficulty. The point of this finding is that any quoted accuracy figure from a learning platform has to state which answers it includes. - In quiz-context first attempts in the same dataset, raw accuracy was 67.8% at N3 (n=5,985; 95% CI 66.6%–69.0%) and 69.4% at N2 (n=2,726; 95% CI 67.6%–71.1%); the confidence intervals overlap, so this dataset cannot separate N2 from N3.
Do not report this as "N2 is harder than N3" or the reverse. - In quiz-context first attempts in the same dataset, raw accuracy by JLPT level was N5 90.2% (n=19,395), N1 76.0% (n=3,040), N4 73.4% (n=6,099), N2 69.4% (n=2,726) and N3 67.8% (n=5,985) — N1 raw accuracy sits above both N2 and N3.
The levels use different question sets, there is no IRT equating, and the sample is self-selected (whoever attempts N1 items tends to be further along), so this ordering cannot be read as the objective difficulty of JLPT levels. - In quiz-context first attempts in the same dataset, the spread within particles is wider than the spread between JLPT levels: the particle が was answered correctly 60.9% of the time (n=358; 95% CI 55.8%–65.8%) and を 78.7% (n=385; 95% CI 74.3%–82.5%) — 17.8 points apart, against 5.6 points between N3 (67.8%) and N4 (73.4%).
The teaching implication is that allocating practice by JLPT level may be coarser than allocating it by knowledge point. - In quiz-context first attempts in the same dataset, grammar patterns are the lowest-scoring axis at every JLPT level: 64.0% at N5 (n=1,939), 48.0% at N4 (n=1,734), 49.2% at N3 (n=2,531), 51.1% at N2 (n=1,179) and 57.0% at N1 (n=1,295).
Vocabulary at the same levels: 94.4% at N5, 89.0% at N4, 84.0% at N3, 85.0% at N2 and 89.2% at N1. - In the same dataset, computed over exactly the same 372 learner identifiers and the same 34,392 answer events, one-vote-per-answer (event weighting) gives 82.53% while one-vote-per-identifier gives 75.49% — a difference of 7.04 percentage points.
Both figures use the identical population and analysis set; the difference comes purely from the weighting choice. Any report quoting a learning-platform accuracy figure should state which weighting it uses. - In the same dataset, answering volume is highly concentrated: the single most active learner identifier accounts for 3.73% of all 56,613 answer events, and the top 10 identifiers together account for 19.44%.
This concentration is the direct reason the two weightings differ by 7 points, and it is a structural bias shared by learning-platform data in general. - In the same dataset, a paired comparison restricted to the 75 learner identifiers that answered in both contexts (at least 5 answers on each side) gives 86.57% in the lesson context (n=5,858) versus 55.52% in the quiz context (n=2,055), a paired mean difference of 27.47 percentage points (95% CI 22.56–32.39).
This shows the gap between contexts is not an artefact of who answered where; but because a same-question comparison is impossible (see finding 3), the context effect still cannot be separated from item difficulty.
Each finding is expanded, tabulated and charted in the sections below. If you just want the numbers, go to Download the data; to cite, see How to cite; for questions, see the contact section.
1. Five main findings
1. Grammar patterns are the only axis below 60%, 38 points behind vocabulary
Among quiz-context first attempts (see Methodology for the set definition), vocabulary items were answered correctly 92.1% of the time (n=22,869, 627 learner identifiers, 95% CI 91.8%–92.5%), while grammar-pattern items reached only 53.7% (n=8,678, 532 identifiers, 95% CI 52.6%–54.7%).
The confidence intervals are far apart, so this is not sampling noise. The data shows a large gap between the two axes; it says nothing about why.
2. Grammar-pattern "accuracy" runs from 53.7% to 74.1% depending on which answers are included
Under different analysis-set definitions, observed accuracy on the grammar-pattern axis ranges from 53.7% (quiz-context first attempts, n=8,678) to 74.1% (all answer events, n=24,293). Because the events included and the learner-identifier composition both differ, the whole difference cannot be read as the product of a single counting rule.
Step by step:
| Step | n | Raw accuracy | Change vs previous |
|---|---|---|---|
| All answer events | 24,293 | 74.1% | — |
| → keep only first attempts | 22,638 | 73.2% | -0.87 pp |
| → keep only quiz contexts (drop lesson/review) | 8,678 | 53.7% | -19.54 pp |
| (comparison) lesson-context first attempts | 13,937 | 85.4% | — |
Removing repeat attempts moves the figure by only 0.9 percentage points. Almost all the remainder comes from the difference between lesson-context and quiz-context answers.
Paired comparison on the same learner identifiers: 75 identifiers have at least 5 grammar-pattern first attempts in each context. They reach 86.6% in the lesson context (n=5,858) and 55.5% in the quiz context (n=2,055), a paired mean difference of +27.5 pp (95% CI 22.6–32.4; median +26.9). So the gap is not simply a matter of who is answering.
⚠️ A same-question comparison is not possible, so no conclusion can be drawn. Of 5,772 distinct grammar-pattern questions, only 6 appear in both contexts, and only 1 has at least 3 answers on each side. The two contexts draw on almost disjoint question sets, so the context effect cannot be separated from differences in question difficulty. The lesson-context questions may simply be easier.
What can honestly be said is this: when citing an accuracy figure from a learning platform, always ask which analysis set it came from. All four sets are in the downloadable data.
3. N3 and N2 have the lowest raw accuracy — but this data cannot separate them
Quiz-context first-attempt raw accuracy by level: N5 90.2%, N4 73.4%, N3 67.8%, N2 69.4%, N1 76.0%.
The intervals for N3 (95% CI 66.6%–69.0%) and N2 (95% CI 67.6%–71.1%) overlap, so it is not correct to say "N3 is harder than N2". What can be said is that in this sample, N2 and N3 both sit below N4, N1 and N5 on raw accuracy.
⚠️ More importantly, each level draws on a completely different question set. This ordering is not a difficulty comparison and is not evidence about which JLPT level is objectively harder.
4. The spread within particles is wider than the spread between levels
Quiz-context first-attempt accuracy on individual particles: が 60.9% (n=358, CI 55.8%–65.8%), に 62.4% (n=370), で 63.3% (n=330), versus を 78.7% (n=385, CI 74.3%–82.5%) and の 83.3% (n=120).
The intervals for が and を do not overlap; the gap is 18 percentage points.
5. One-vote-per-identifier and one-vote-per-answer differ by 7.04 points
Computed over exactly the same 372 learner identifiers, the same analysis set and the same 34,392 eligible events:
| Weighting | Accuracy |
|---|---|
| Event-weighted (one vote per answer) | 82.5% |
| Identifier-weighted (one vote per identifier) | 75.5% (median 76.2%) |
| WEIGHTING_EFFECT_PP | 7.04 pp |
Cohort: Learner identifiers with at least 20 answers in the primary analysis set. Both figures share the same numerator population and denominator, so the gap reflects the weighting choice alone and is not contaminated by differences in sample composition.
The cause is repeated measures: the single most active identifier accounts for 3.7% of all answers and the top ten for 19.4%. Any study using platform data hits this, so we publish both numbers.
2. Dataset overview
| Item | Value |
|---|---|
| Valid answer events | 56,613 |
| Anonymous learner identifiers (upper bound on people) | 1,053 |
| Distinct questions | 11,987 |
| Knowledge points | 39 |
| Temporal coverage | 2 to 13 August 2026 (12 days); the first day is partial |
| Snapshot cutoff | 2026-08-14T00:00:00Z |
| First-attempt events | 52,934 |
| Quiz-context first attempts (primary set) | 37,245 |
| Learner identifiers in the primary set | 688 |
| Lesson-context first attempts (comparison set) | 15,741 |
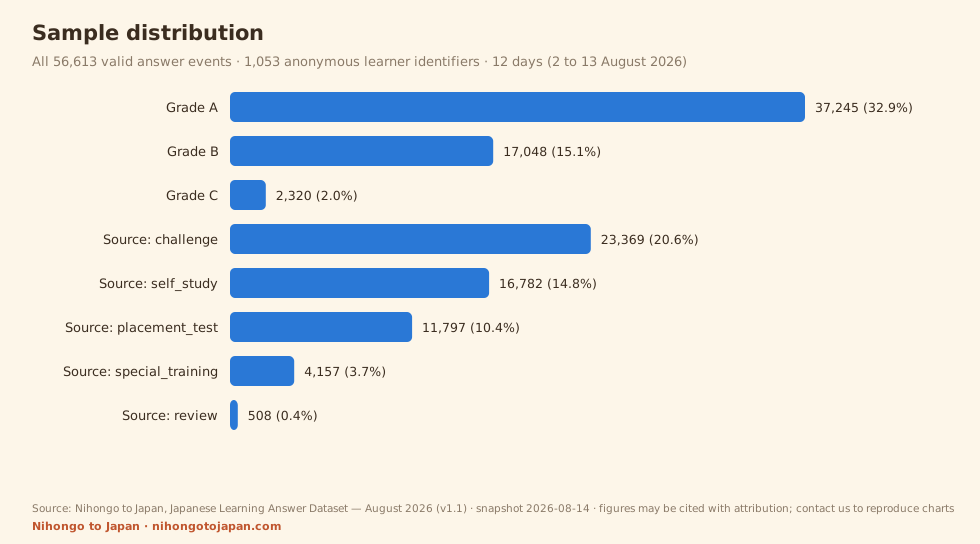
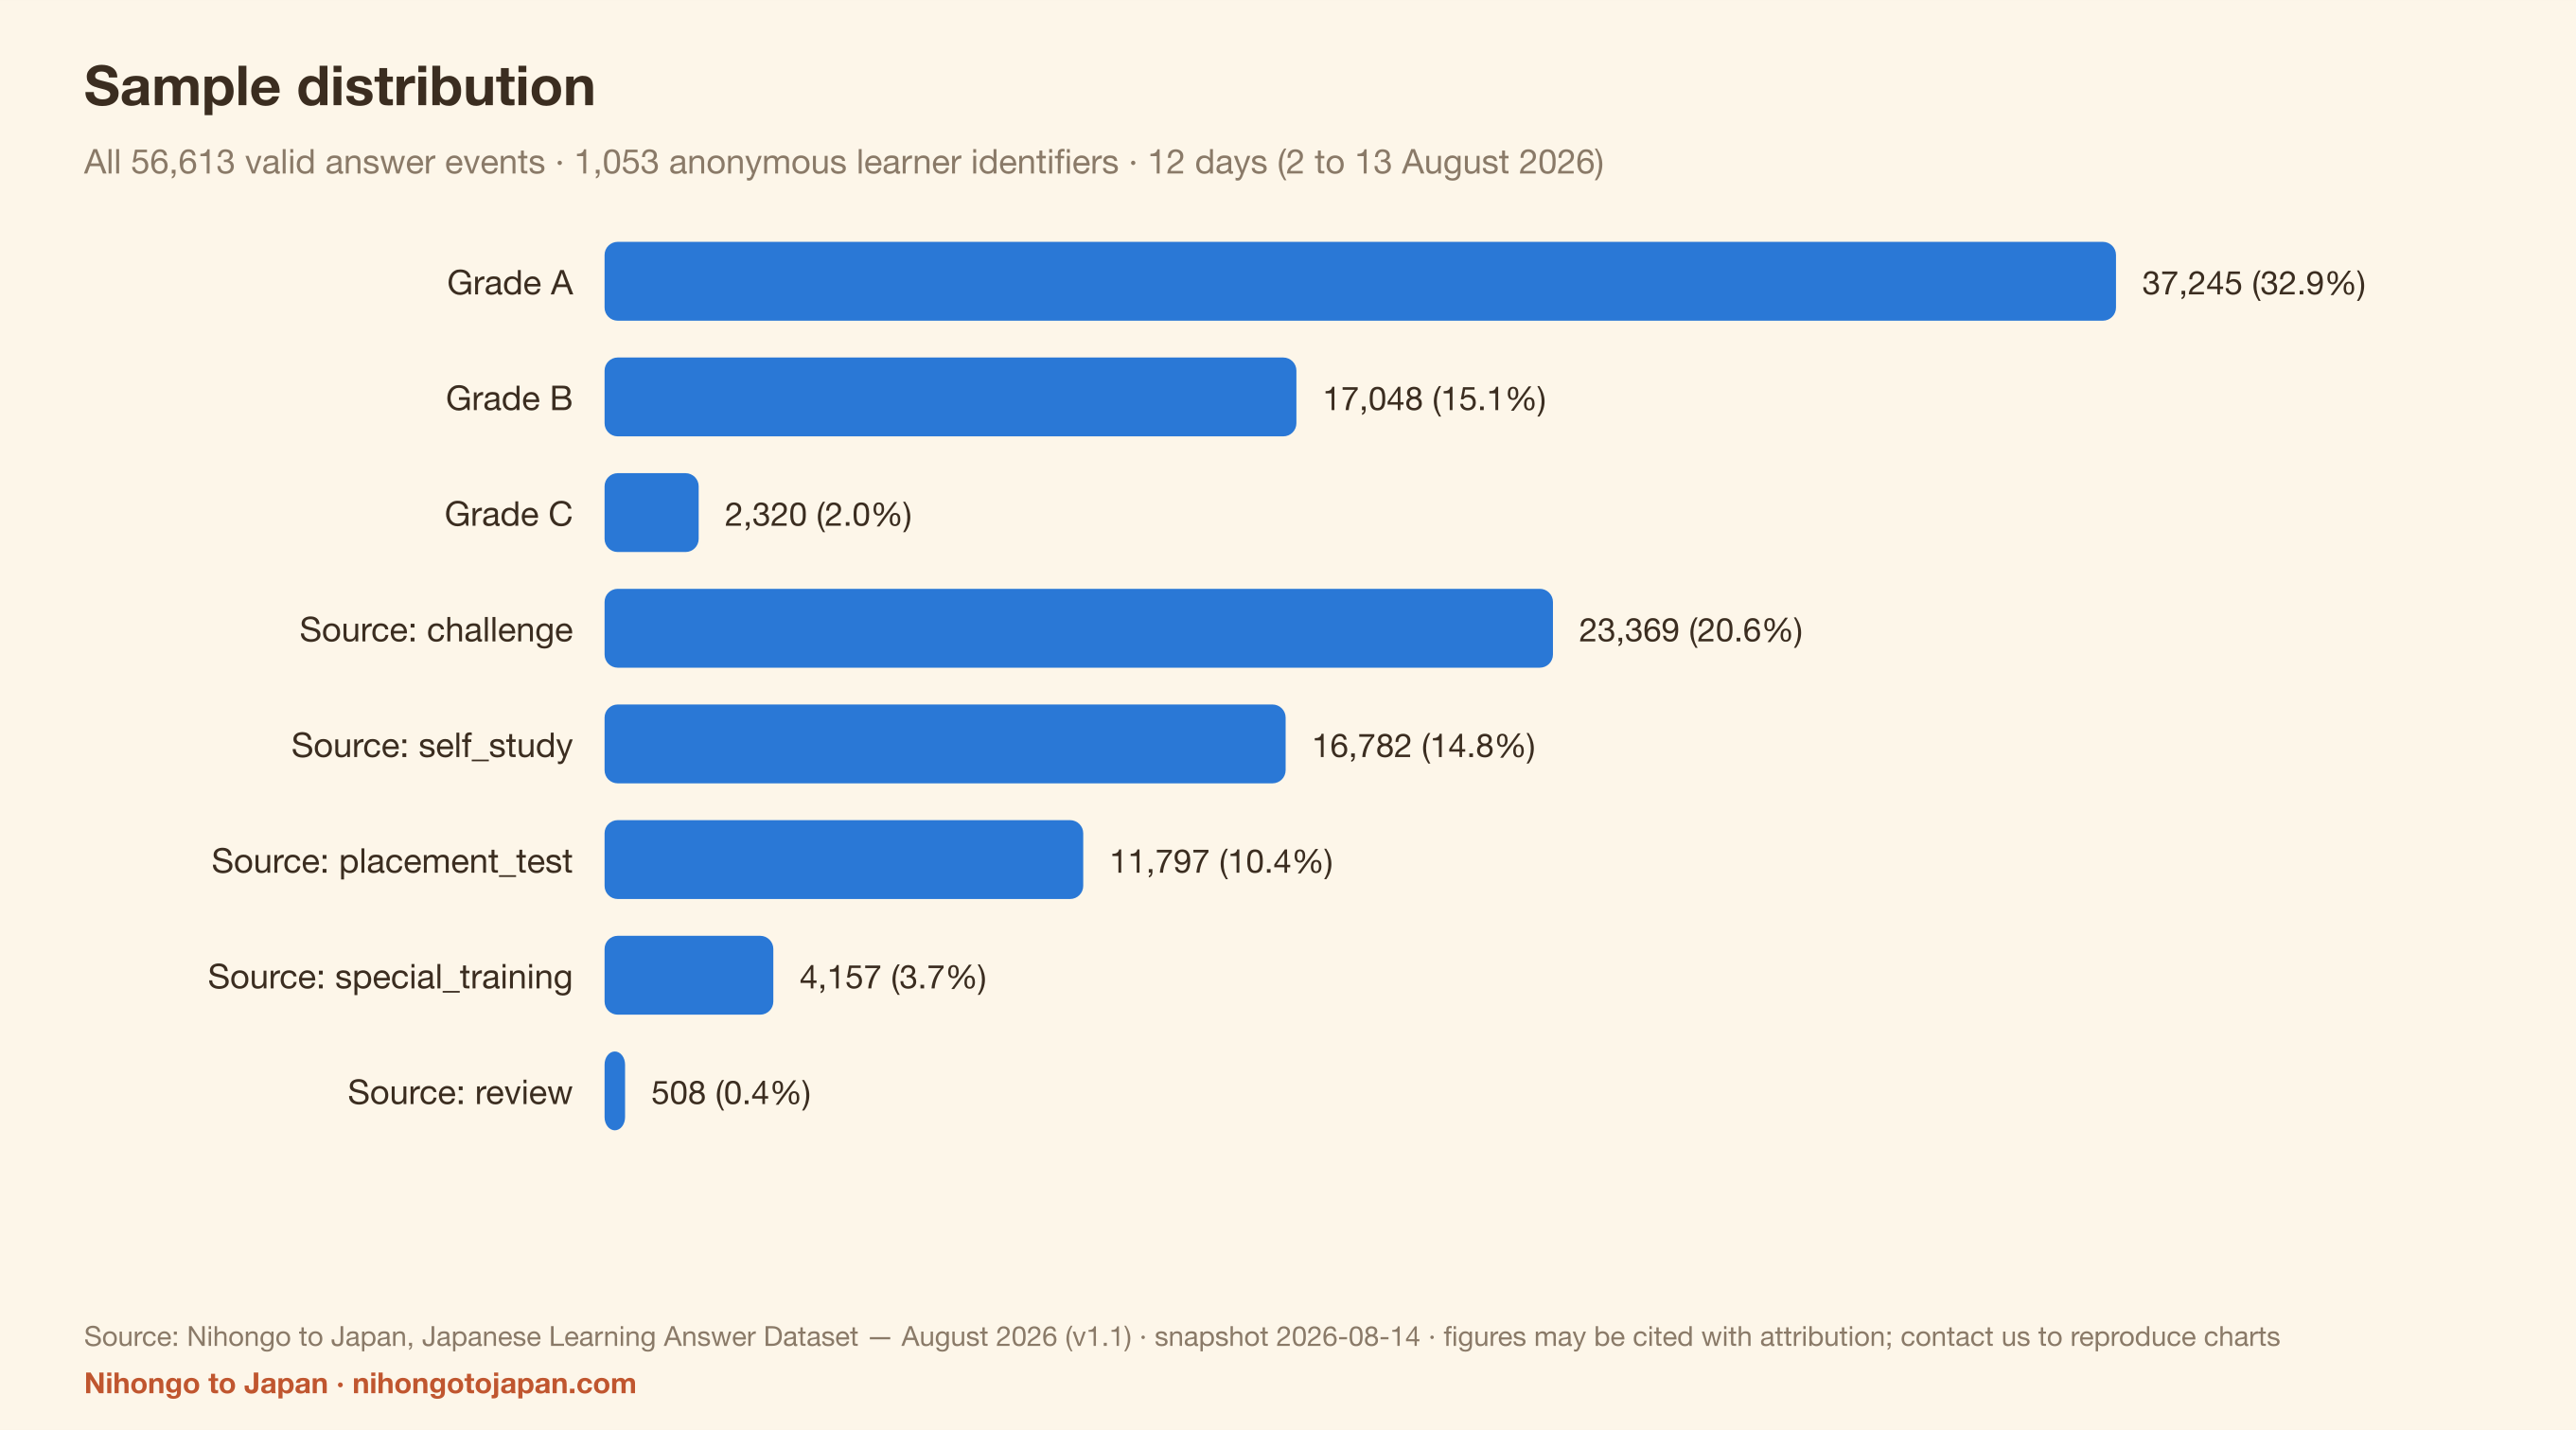
Answers by source: challenge 23,369 (41.3%), self_study 16,782 (29.6%), placement_test 11,797 (20.8%), special_training 4,157 (7.3%), review 508 (0.9%).
Distribution of the database evidence_class column (a raw table field, not the name of an analysis set in this report): A 37,245 (65.8%), B 17,048 (30.1%), C 2,320 (4.1%). The primary analysis set is exactly evidence_class = A.
3. Accuracy by learning axis
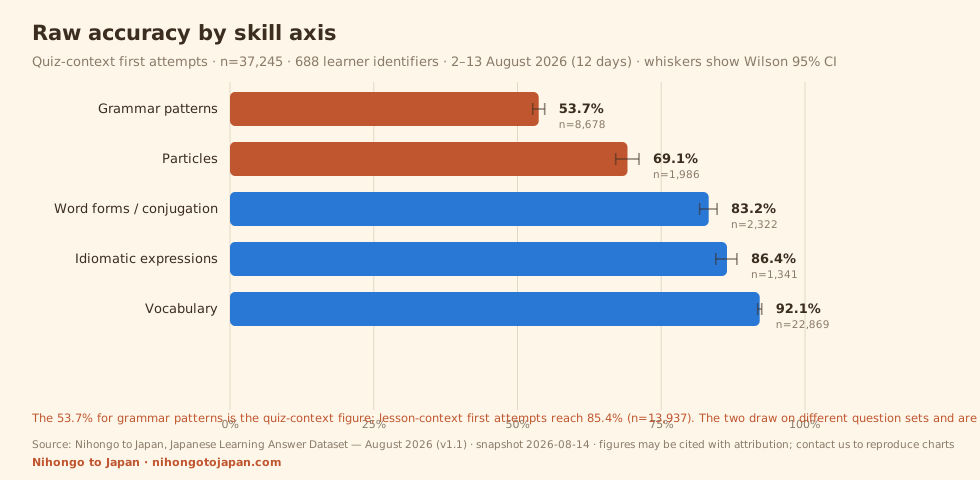
| Skill axis | n | Identifiers | Raw accuracy | 95% CI | Flag |
|---|---|---|---|---|---|
| Grammar patterns | 8,678 | 532 | 53.7% | 52.6%–54.7% | OK |
| Particles | 1,986 | 137 | 69.1% | 67.1%–71.1% | OK |
| Word forms / conjugation | 2,322 | 386 | 83.2% | 81.7%–84.7% | OK |
| Idiomatic expressions | 1,341 | 261 | 86.4% | 84.5%–88.2% | OK |
| Vocabulary | 22,869 | 627 | 92.1% | 91.8%–92.5% | OK |
The following axes fall below the minimum cell size (n<30 or fewer than 5 learner identifiers), so no accuracy figure is published — only the event count: Mixed / all-round (n=27, 8 identifiers), Reading comprehension (n=22, 4 identifiers).
4. Accuracy by JLPT level
⚠️ This is the section most easily misread. Each level draws on a completely different question set, and no IRT difficulty equating was performed. The figures below are the proportion of these particular questions answered correctly — not a measure of which level is harder.
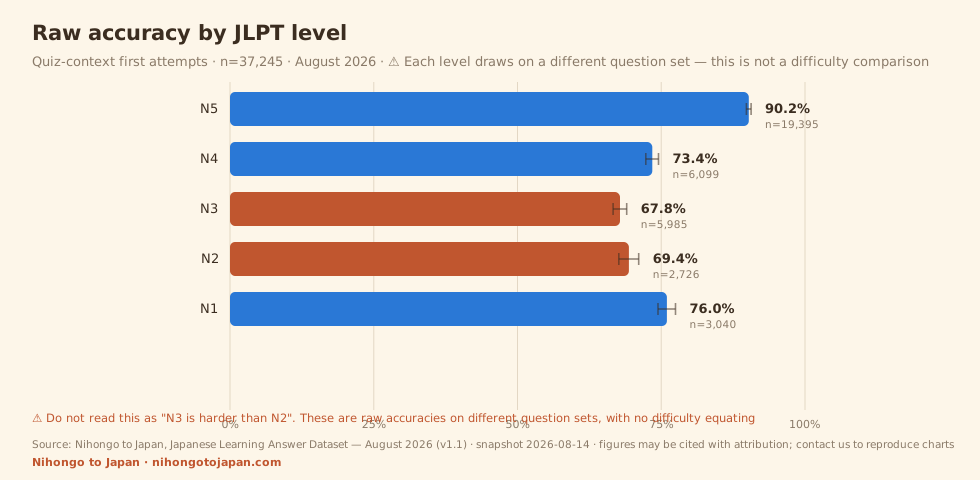
| JLPT level | n | Identifiers | Raw accuracy | 95% CI |
|---|---|---|---|---|
| N5 | 19,395 | 380 | 90.2% | 89.8%–90.6% |
| N4 | 6,099 | 313 | 73.4% | 72.3%–74.5% |
| N3 | 5,985 | 432 | 67.8% | 66.6%–69.0% |
| N2 | 2,726 | 212 | 69.4% | 67.6%–71.1% |
| N1 | 3,040 | 139 | 76.0% | 74.4%–77.5% |
The same levels across all four analysis sets:
| Level | Quiz-context first (primary) | Lesson-context first | First attempts (all) | All events |
|---|---|---|---|---|
| N5 | 90.2% (n=19,395) | 83.7% (n=11,154) | 87.8% (n=30,495) | 88.2% (n=33,286) |
| N4 | 73.4% (n=6,099) | 83.1% (n=2,694) | 76.5% (n=8,758) | 76.6% (n=9,262) |
| N3 | 67.8% (n=5,985) | 82.1% (n=1,507) | 70.8% (n=7,522) | 71.1% (n=7,727) |
| N2 | 69.4% (n=2,726) | 79.2% (n=260) | 70.2% (n=2,985) | 70.5% (n=3,072) |
| N1 | 76.0% (n=3,040) | 86.5% (n=126) | 76.4% (n=3,174) | 76.5% (n=3,266) |
5. Lowest-accuracy knowledge points
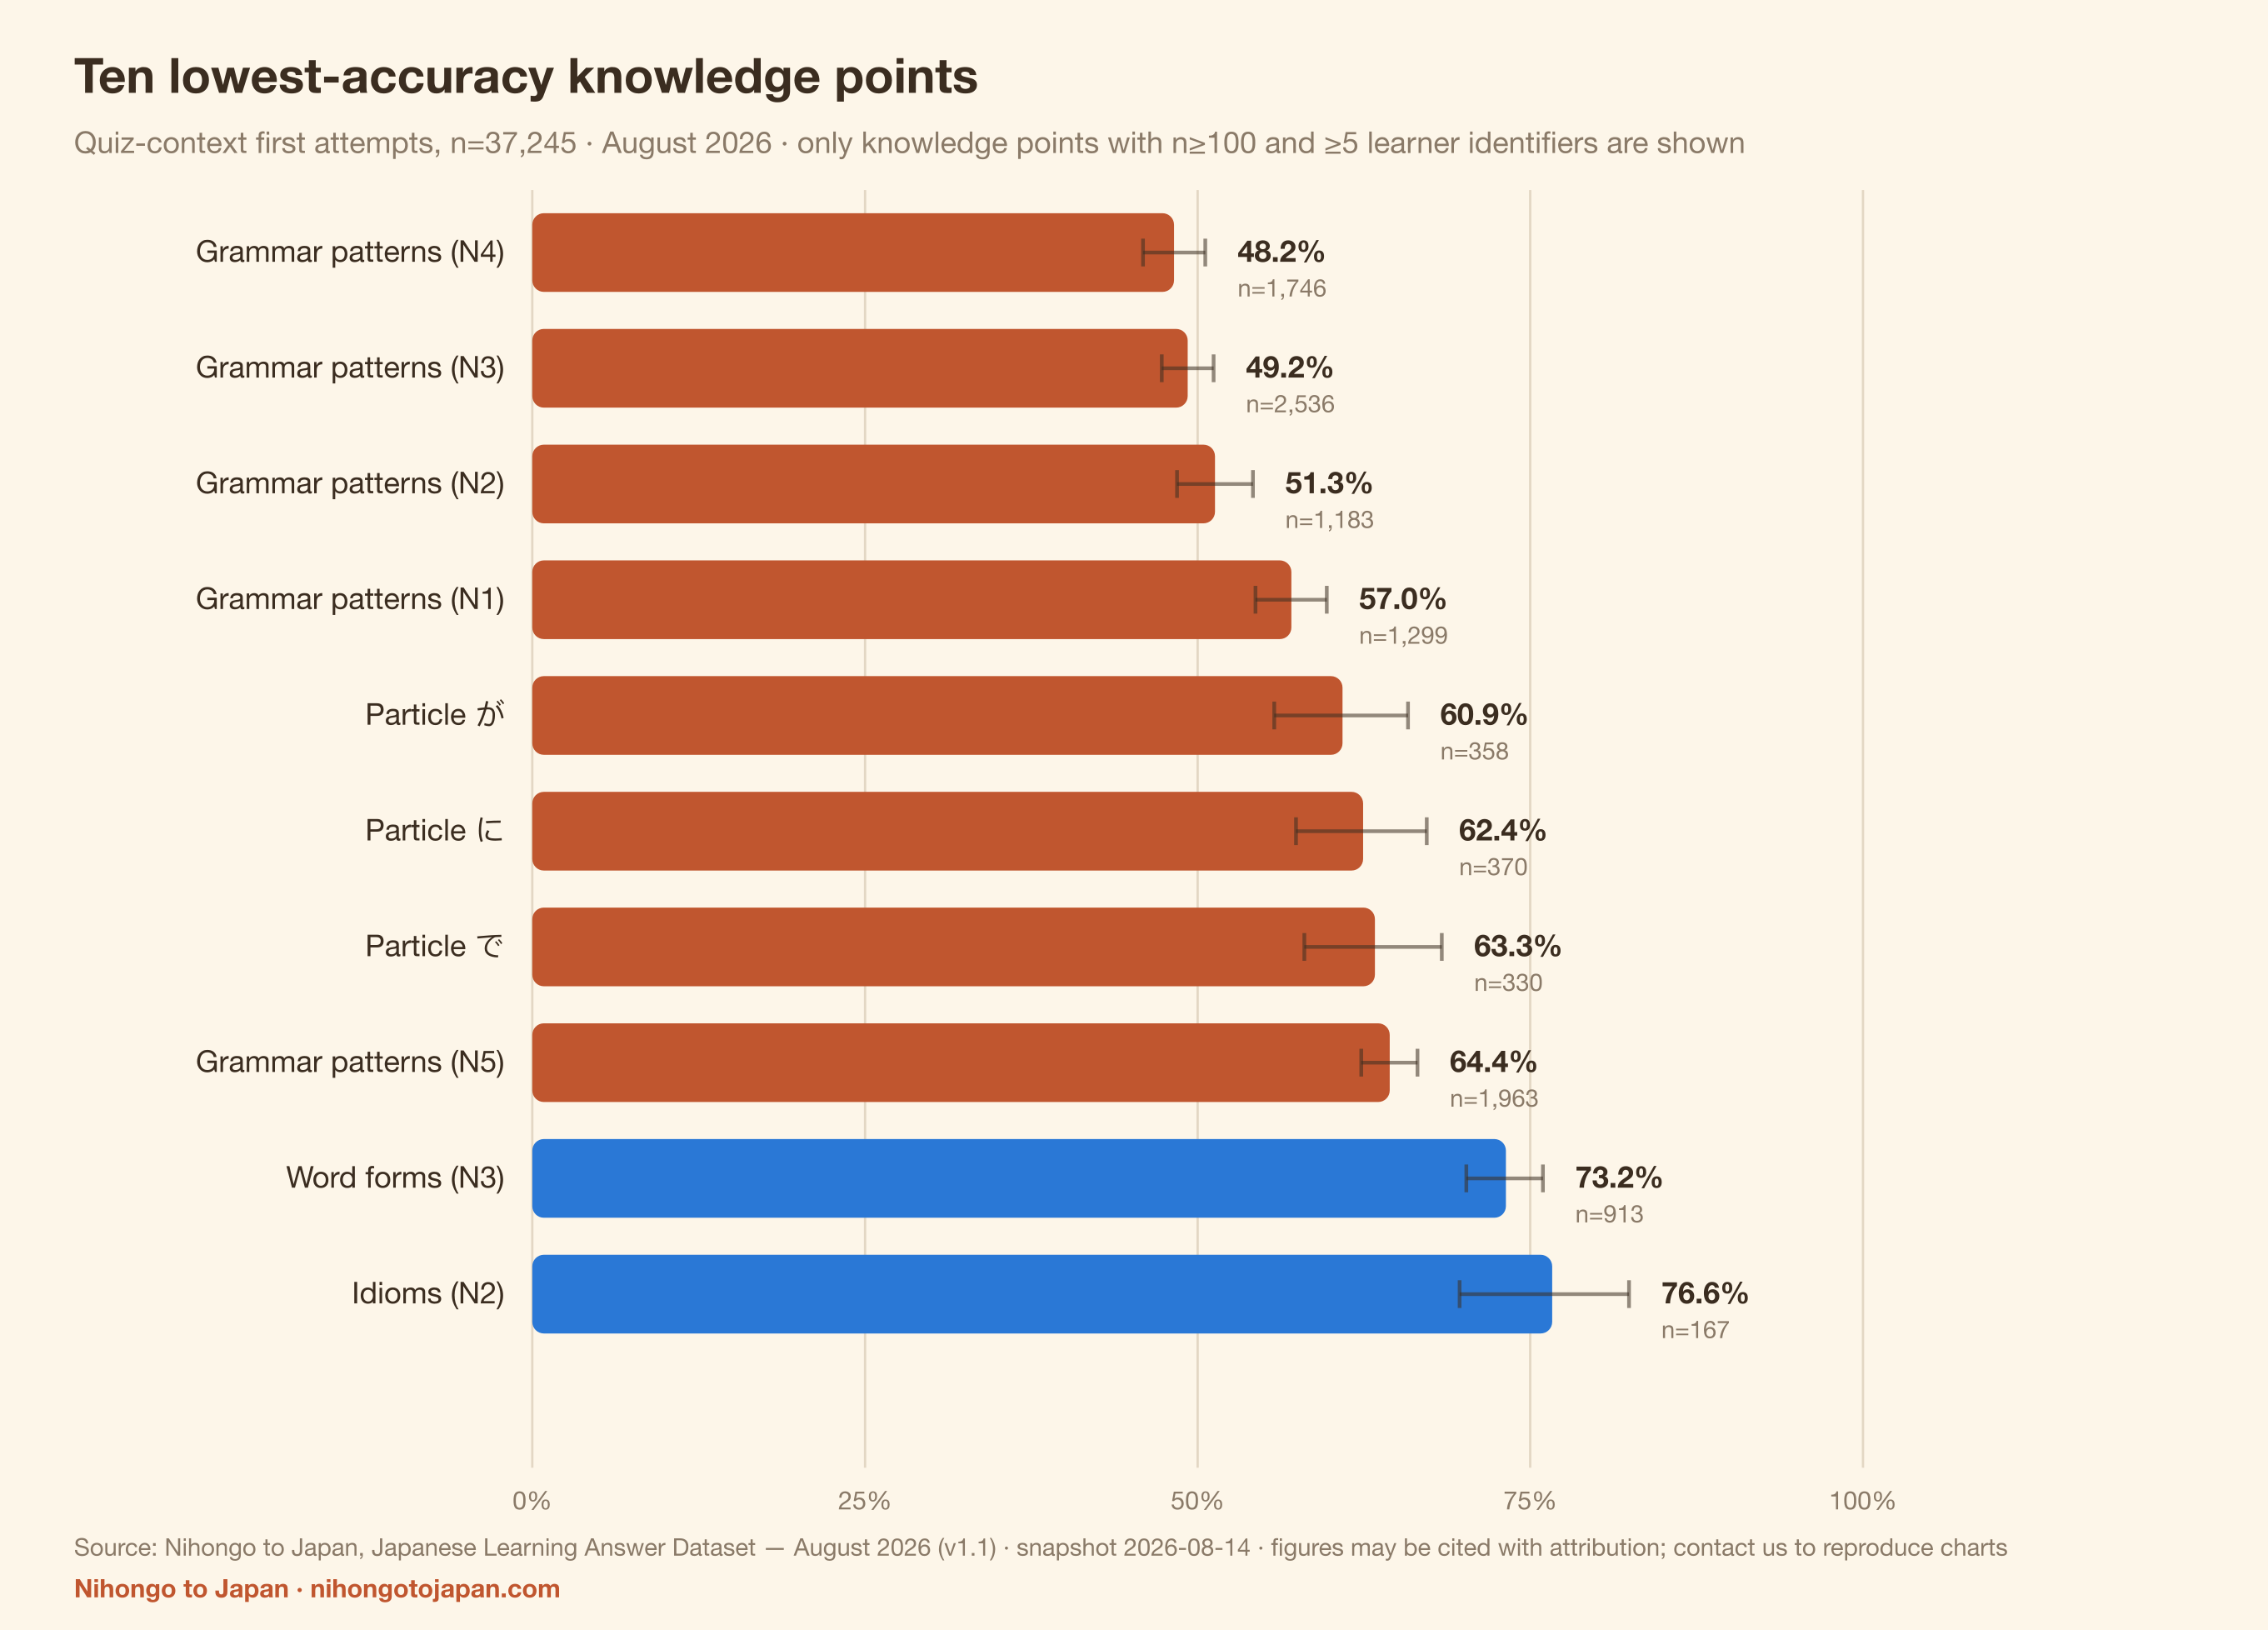
Only knowledge points with n≥100 and at least 5 learner identifiers are listed (23 qualify). n, level and category are shown alongside the percentage — small cells look extreme for reasons that are usually just noise.
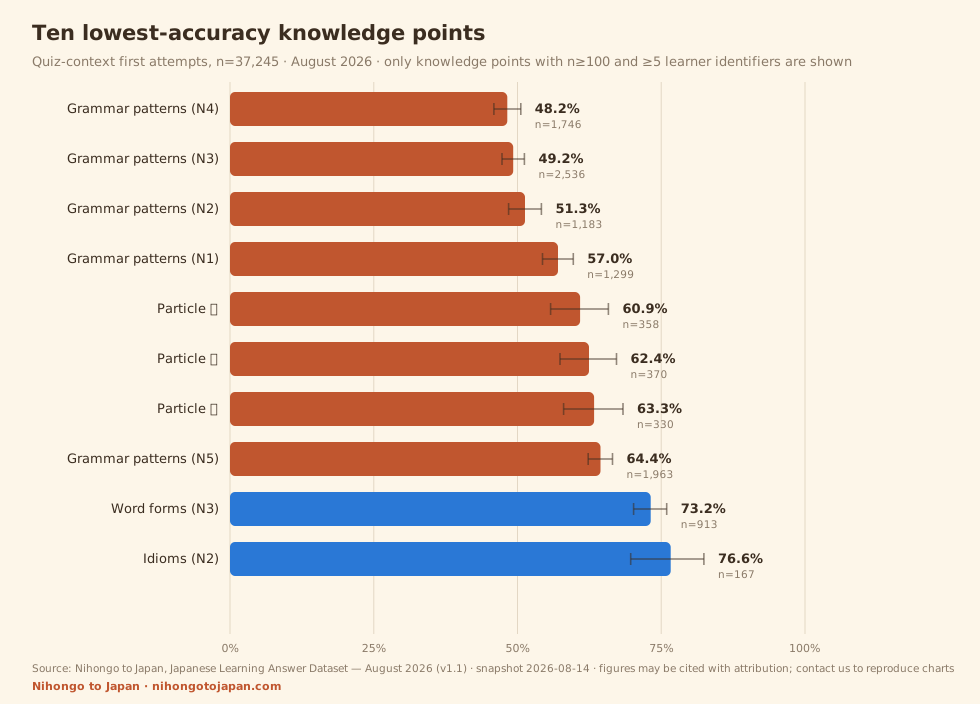
| # | Knowledge point | Category | Level | n | Identifiers | Raw accuracy | 95% CI |
|---|---|---|---|---|---|---|---|
| 1 | Grammar patterns (N4) | Grammar patterns | N4 | 1,746 | 234 | 48.2% | 45.9%–50.6% |
| 2 | Grammar patterns (N3) | Grammar patterns | N3 | 2,536 | 390 | 49.2% | 47.3%–51.2% |
| 3 | Grammar patterns (N2) | Grammar patterns | N2 | 1,183 | 191 | 51.3% | 48.5%–54.1% |
| 4 | Grammar patterns (N1) | Grammar patterns | N1 | 1,299 | 118 | 57.0% | 54.3%–59.7% |
| 5 | Particle が | Particles | — | 358 | 81 | 60.9% | 55.8%–65.8% |
| 6 | Particle に | Particles | — | 370 | 75 | 62.4% | 57.4%–67.2% |
| 7 | Particle で | Particles | — | 330 | 85 | 63.3% | 58.0%–68.3% |
| 8 | Grammar patterns (N5) | Grammar patterns | N5 | 1,963 | 209 | 64.4% | 62.3%–66.5% |
| 9 | Word forms (N3) | Word forms | N3 | 913 | 294 | 73.2% | 70.2%–75.9% |
| 10 | Idioms (N2) | Idioms | N2 | 167 | 62 | 76.6% | 69.7%–82.4% |
| 11 | Particle を | Particles | — | 385 | 61 | 78.7% | 74.3%–82.5% |
| 12 | Word forms (N2) | Word forms | N2 | 278 | 107 | 80.2% | 75.1%–84.5% |
6. Most consistent strengths
| # | Knowledge point | Category | Level | n | Identifiers | Raw accuracy | 95% CI |
|---|---|---|---|---|---|---|---|
| 1 | Word forms (N1) | Word forms | N1 | 296 | 79 | 95.6% | 92.6%–97.4% |
| 2 | Vocabulary (N5) | Vocabulary | N5 | 16,029 | 311 | 94.4% | 94.0%–94.8% |
| 3 | Vocabulary (N1) | Vocabulary | N1 | 703 | 94 | 89.2% | 86.7%–91.3% |
| 4 | Vocabulary (N4) | Vocabulary | N4 | 2,828 | 243 | 89.0% | 87.8%–90.1% |
| 5 | Idioms (N1) | Idioms | N1 | 742 | 111 | 88.8% | 86.3%–90.9% |
| 6 | Word forms (N4) | Word forms | N4 | 461 | 149 | 87.0% | 83.6%–89.8% |
| 7 | Idioms (N4) | Idioms | N4 | 140 | 91 | 86.4% | 79.8%–91.1% |
| 8 | Idioms (N3) | Idioms | N3 | 290 | 142 | 85.9% | 81.4%–89.4% |
7. Observed patterns worth noting
Observation A: N1 raw accuracy sits above N2 and N3
N1 76.0% (n=3,040, 139 identifiers) is above N2 69.4% and N3 67.8%.
This is an observed pattern, not evidence that N1 is easier. At least three explanations cannot be ruled out with this data: only 139 identifiers answered N1 items versus 432 for N3, so the groups differ in composition; the question sets differ; and no ability estimation was performed. Answering "which level is genuinely harder" needs IRT equating and an anchor-item design, and this dataset has neither.
Observation B: the grammar-pattern axis is the lowest at every level
| Axis × level | n | Identifiers | Raw accuracy | 95% CI |
|---|---|---|---|---|
| Grammar patterns × N4 | 1,734 | 233 | 48.0% | 45.6%–50.3% |
| Grammar patterns × N3 | 2,531 | 389 | 49.2% | 47.2%–51.1% |
| Grammar patterns × N2 | 1,179 | 191 | 51.1% | 48.3%–54.0% |
| Grammar patterns × N1 | 1,295 | 118 | 57.0% | 54.3%–59.7% |
| Particles × N4 | 766 | 92 | 58.5% | 55.0%–61.9% |
| Grammar patterns × N5 | 1,939 | 208 | 64.0% | 61.8%–66.1% |
| Word forms / conjugation × N3 | 948 | 302 | 74.2% | 71.3%–76.8% |
| Particles × N5 | 1,220 | 111 | 75.8% | 73.3%–78.1% |
| Idiomatic expressions × N2 | 167 | 62 | 76.6% | 69.7%–82.4% |
| Word forms / conjugation × N2 | 278 | 107 | 80.2% | 75.1%–84.5% |
Crossing axis with level, almost every one of the lowest cells is a grammar-pattern cell. That is more informative than the level breakdown on its own.
8. What teachers and materials designers can use this for
This section deliberately separates data from interpretation. The data is citable; the interpretation is our judgement, and you are free to disagree with it.
| Data (citable) | Interpretation (our judgement, not data) |
|---|---|
| Quiz-context first attempts: grammar-pattern axis 53.7% vs vocabulary 92.1% (n=8,678 and 22,869) | On this platform there is a clear gap between recognising words and assembling sentences. If practice time has to be allocated, grammar patterns may have the higher marginal return. |
| が 60.9%, に 62.4%, で 63.3% sit well below を 78.7% and の 83.3% | を and の have comparatively narrow functions, while が, に and で are heavily polysemous. Teaching the distinct functions of a single particle separately may work better than introducing particles one at a time. |
| N2 and N3 raw accuracy (69.4% / 67.8%) sit below N4, N1 and N5 | ⚠️ Do not use this to rank difficulty. A more plausible reading is that the learners answering at N2/N3 differ in composition from those at other levels, rather than anything about the items. |
| Grammar patterns: 85.4% in the lesson context (n=13,937) vs 53.7% in the quiz context (n=8,678); paired difference +27.5 pp across 75 identifiers | In-lesson and quiz answering produce very different results — worth keeping in mind when platform practice scores are used to judge learning outcomes. ⚠️ But the two contexts use almost disjoint question sets, so we cannot say whether this is the context or simply easier questions. |
9. Methodology
| Item | Detail |
|---|---|
| Population | Answer records produced by learners using Nihongo to Japan. |
| Sampling | Self-selected, observational sample. Not random sampling; not population-representative. |
| Unit of analysis | answer event (one learner identifier answering one question once). |
| User count | learner identifiers = distinct anonymous identifiers. They cannot be merged across devices, so this is an upper bound on the number of people, not a verified headcount. |
| Metric | raw accuracy = correct ÷ valid answer events. Not an ability estimate. |
| Confidence intervals | Wilson 95% CI. Reflects sampling error only; does not correct for selection bias. |
Four analysis sets
| Set | Definition | n |
|---|---|---|
| Quiz-context first attempts (primary analysis set) | Answers from challenge / placement_test / special_training where this is the learner identifier’s first attempt at that question, not a repeat within 24 hours, with complete question metadata. | 37,245 |
| Lesson-context first attempts (comparison set) | First attempts from self_study / review — answers given while working through the lesson material. | 15,741 |
| First attempts (all contexts) | Each learner identifier's first answer to each question, regardless of source. | 52,934 |
| All answer events | Every valid answer event, including repeats. | 56,613 |
⚠️ The primary set makes no claim about hints or explanations. The fieldsused_hint/viewed_explanation/used_answer_keyare false throughout the database, but only because no producer ever writes them — none of the answer-capture call sites passes these parameters, and the product currently has no pre-answer hint or answer-reveal feature. The constant false is a property of the instrumentation, not evidence about learner behaviour. These fields are therefore not used as analysis conditions, and no claim is made about hint use.
Independent verification of the primary set: recomputing the earliest event per (identifier, question) on the server, 99.59% of primary-set events (37,094 of 37,245) pass the first-attempt test. The 151 that do not are most likely cross-device — the same person answering on two devices, each recording a first attempt. Every event in the set has attempt_number = 1.
What is excluded
- Known degraded questions: 520 question ids are excluded from every aggregate. Two causes: (1) non-grammar cloze items from the lesson materials (kana conversion, orthography, numeric answers) mis-tagged into the grammar-pattern axis; (2) an older "question of the day" build that used the answer token as the question identifier, collapsing different questions onto one id. The front end has been fixed; historical data is excluded via a denylist. No raw event was deleted — the table is append-only.
- Events after the snapshot cutoff: this report is frozen at 2026-08-14T00:00:00Z. Data keeps accumulating, but every figure on this page and in the downloadable files comes from that single frozen point.
Minimum cell size
Cells with n<30 or fewer than 5 learner identifiers are SUPPRESSED: the event count is published but the accuracy is not. Cells with n≥30 and ≥5 identifiers but n<100 are flagged LOW_SAMPLE and should always be cited with n. Cells with n≥100 and ≥5 identifiers are flagged OK.
In this snapshot 23 knowledge points are OK, 12 are LOW_SAMPLE and 3 are SUPPRESSED.
Anonymisation
- Each event carries only an anonymous device UUID generated in the browser. No name, email, IP address, device fingerprint, or free-text input of any kind.
- The receiving Cloudflare Pages Function writes whitelisted columns only and explicitly never writes IP addresses.
- The public dataset contains aggregate statistics only — not a single raw answer event.
- Learners can opt out of aggregate collection with one click on the privacy policy page.
10. Limitations (please cite these alongside the figures)
If you read only one paragraph, read this one. This data describes how people who came to Nihongo to Japan to practise performed on Nihongo to Japan questions. It is not a picture of Japanese learners in Taiwan, it is not a measure of JLPT difficulty, and it cannot be used to compare the objective difficulty of different levels.
- Selection bias: the sample is people who chose to practise here. They are likely more motivated than learners in general, and possibly younger and more comfortable with online tools.
- Repeated measures: the single most active identifier accounts for 3.7% of all answers and the top ten for 19.4%. Across the same 372 identifiers, event weighting and identifier weighting differ by 7.04 percentage points.
- Analysis sets are not directly subtractable: the lesson and quiz contexts draw on almost disjoint question sets (of 5,772 grammar-pattern questions, only 6 appear in both), so the accuracy gap between them cannot be attributed to a single cause.
- Hint and explanation behaviour is unobservable: the relevant fields are never written, so this dataset makes no claim at all about them.
- Unequal question difficulty: each level and axis draws on a different question set, so raw accuracy is not a normalised difficulty measure.
- No IRT equating: there is no item-response-theory equating and no anchor-item design across levels, so this data cannot answer which level is harder.
- Unequal sample sizes: there are more than six times as many N5 answers as N1 answers.
- Short time window: 12 days only (the aggregation pipeline went live on 2026-08-02). No longitudinal trend can be read from this data.
- Automated traffic cannot be identified: there is no mechanism to distinguish humans from scripts. Response time is null for 94% of events, so even a basic "answered impossibly fast" filter is unavailable. This is a known data-quality gap.
- Not population-representative: it does not represent all Japanese learners in Taiwan or in any other country.
11. How to cite
Citation in papers, research reports, teaching materials and journalism is welcome. Please credit the source with a link back to this page.
APA (7th)
Nihongo to Japan. (2026). Japanese learning answer dataset — August 2026 (Version 1.1.0) [Data set]. https://www.nihongotojapan.com/en/research/japanese-learning-data-2026MLA (9th)
Nihongo to Japan. Japanese Learning Answer Dataset — August 2026. Version 1.1.0, 2026, https://www.nihongotojapan.com/en/research/japanese-learning-data-2026.BibTeX
@misc{ntj_jlad_2026,

  title = {Japanese Learning Answer Dataset --- August 2026},

  author = {{Nihongo to Japan}},

  year = {2026},

  version = {1.1.0},

  note = {Snapshot 2026-08-14; aggregate statistics from 56,613 anonymous answer events, 2--13 August 2026},

  url = {https://www.nihongotojapan.com/en/research/japanese-learning-data-2026}

}
Licence status
The data is released under CC BY 4.0: free to use, including commercially, provided you give credit. The charts and the text of the report are not covered. Full terms in the Licence section.
Suggested attribution string:
Nihongo to Japan, Japanese Learning Answer Dataset — August 2026, v1.1.0, CC BY 4.0, https://www.nihongotojapan.com/research/japanese-learning-data-2026Licence: the data is CC BY 4.0
The data in this dataset is released under Creative Commons Attribution 4.0 International (CC BY 4.0). You may copy, redistribute, adapt and build upon it, including commercially, provided you give appropriate credit and indicate if changes were made.
⚠️ The licence covers the data only. What CC BY 4.0 covers: the aggregate figures on this page and the two downloadable files,japanese-learning-2026.jsonandjapanese-learning-2026.csv. The charts produced by Nihongo to Japan (SVG/PNG) and the text of the report are not covered and remain rights-reserved.
What you can do without asking us
- Cite the statistics in papers, research reports, teaching materials and journalism, including commercial publications.
- Re-analyse the aggregate figures and produce your own charts — charts you draw are yours.
- Adapt, remix, transform and redistribute in any form, including redistributing the data files wholesale or bundling them into your own data product.
- Use the data in classrooms and educational settings.
Attribution
Nihongo to Japan, Japanese Learning Answer Dataset — August 2026, v1.1.0, CC BY 4.0, https://www.nihongotojapan.com/research/japanese-learning-data-2026What we ask for (not licence conditions)
The following are not conditions of CC BY, and ignoring them is not an infringement. We ask for them anyway, with the reason attached to each:
- Carry the sampling limitations (self-selected observational sample, 12 days only, not representative) — quoting the numbers without them publishes a misleading statistic.
- Link back to this page — so your readers can see the methodology and the version.
- Write "learner identifiers", not "people" — the identifier count is an upper bound on the number of people, not a headcount.
- State the version (e.g. v1.1.0, snapshot 2026-08-14) — so the figures you cited stay identifiable after later updates.
What the licence does not cover
- The charts we produced (
/images/research/*.svgand*.png): please contact us before reproducing them. Drawing your own charts from the data needs no permission. - The text of the report and of this website: rights reserved.
- The site name, logo and brand marks: this licence grants no rights to use them.
⚠️ CC BY is irrevocable. Anyone who receives the data under these terms keeps those rights even if we change the terms later. We state it here because anyone citing the data is entitled to know how stable their permission is.
12. Download the data
Two formats with identical content, both aggregate statistics only (no raw answer events):
- japanese-learning-2026.json — full metadata, definitions, methodology, limitations and every aggregate cell.
- japanese-learning-2026-LICENSE.txt — the licence notice (CC BY 4.0, scope, attribution string). A CSV has nowhere to carry that, so it ships alongside.
- japanese-learning-2026.csv — one row per cell. Columns:
dimension, key, label_zh, label_en, category, jlpt_level, analysis_set, n, learners, accuracy, ci95_low, ci95_high, flag.
Version 1.1.0 · snapshot 2026-08-14 · methodology version 1.1. Future updates will increment the version and preserve the earlier figures rather than overwriting them in place.
Chart files: all four charts on this page are available as PNG (2× resolution, for slides and print layout) and SVG (vector, scalable).
- Raw accuracy by learning axis:PNG・SVG
- Raw accuracy by JLPT level:PNG・SVG
- Lowest-accuracy knowledge points:PNG・SVG
- Sample distribution:PNG・SVG
Every chart carries its own title, n, version and source label, so it still states its own scope when it travels alone; alt text for all four is collected in alt-text.json. ⚠️ The charts are not covered by CC BY, so please contact us before reproducing them (see contact); the data itself is CC BY 4.0 and free to use with attribution (see Licence).
⚠️ For citation, use the versioned frozen dataset rather than the live aggregate endpoint.
A live aggregate endpoint also exists at /api/aggregates, returning current numbers on each call. It uses different definitions: an all-answer-events basis rather than quiz-context first attempts, and its totalUsers counts only the primary-set learner identifiers (688) rather than all 1,053. Its numbers change daily and are not suitable for citation.
For journalists
- Sample: 56,613 anonymous answers from 1,053 anonymous learner identifiers (not a verified headcount) over 12 days, 2–13 August 2026.
- Method in one line: raw accuracy on a self-selected observational sample; headline figures use the quiz-context first-attempt set (first attempts in the challenge, placement-test and drill contexts).
- Limitation in one line: this is not a representative survey of Japanese learners, and it cannot be used to compare the objective difficulty of JLPT levels.
Three figures you can quote directly:
- Grammar-pattern accuracy 53.7% (n=8,678) versus vocabulary 92.1% (n=22,869) — a gap of 38 points.
- The particle が is answered correctly 60.9% of the time (n=358); を reaches 78.7% (n=385).
- Grammar-pattern accuracy runs from 53.7% to 74.1% depending on which answering contexts are included (lesson context 85.4%, quiz context 53.7%). ⚠️ The two contexts use almost disjoint question sets so the cause cannot be pinned down — but that is itself a story about how learning-platform data gets quoted.
Citation formats · Download the data · Contact
Embed this data (paste into a blog post or teaching material)
Paste the HTML below into your article or handout. It already carries the sample size, version, licence and the "not population-representative" caveat — exactly the parts that get dropped when statistics are quoted second-hand. No need to tell us first.
<blockquote style="margin:0;padding:16px 20px;border-left:4px solid #c0562f;background:#fdf6e9;color:#3b2d20;font-family:system-ui,sans-serif"><p style="margin:0 0 8px">Across 56,613 anonymous answers, grammar-pattern accuracy in quiz-context first attempts was <strong>53.7%</strong> (n=8,678), against <strong>92.1%</strong> for vocabulary (n=22,869).</p><p style="margin:0;font-size:13px;color:#8a7a68">Source: <a href="https://www.nihongotojapan.com/en/research/japanese-learning-data-2026">Nihongo to Japan, Japanese Learning Answer Dataset — August 2026</a> v1.1.0 · CC BY 4.0 · self-selected observational sample, not population-representative</p></blockquote>
Why a paste-able block rather than an iframe? Two reasons: this site does not allow itself to be framed (frame-ancestors 'none' site-wide, a clickjacking protection we would rather keep); and content inside an iframe is served from our domain, so it does not read as a link given by your page — a pasted block does. You are equally free to lay it out yourself: the data is CC BY 4.0, so attribution is all we ask.
For images: our charts are not covered by the licence, but you can draw your own from the CSV and that chart is yours. For teaching or media use of our own charts, see the press kit.
Press kit
Everything in this section may be copied and used without asking us first (except the charts — see below). Quick facts and three directly quotable figures are in For journalists; the full set is in ten quotable findings.
Boilerplate
Long version:
Nihongo to Japan is a free Japanese-learning website run independently by a solo developer in Taiwan. It requires no sign-up and has no paywall, and covers JLPT N5 to N1 through grammar explanations, self-study lessons and practice questions. This dataset is drawn from anonymous answer records produced by learners on the site, aggregated from a frozen snapshot and published with its full methodology and limitations.
Short version:
Nihongo to Japan, an independently run free Japanese-learning site in Taiwan, publishes an aggregate dataset of its learners' anonymous answers.
Images for publication
The charts we produce are not covered by CC BY 4.0 (the licence covers the data only — see Licence). We would rather that did not become an obstacle, so there are two routes:
- Ask us: we send publication-ready image files within 24 hours (PNG and SVG), with the correct caption, sample size and version label. This is a fast lane for images, quicker than general enquiries (2–3 working days).
- Or don't wait — draw your own. The data itself is CC BY 4.0, so you can build your own charts straight from the JSON or CSV. Charts you draw are yours: no permission needed, and no need to tell us.
Four notes for responsible reporting
These are not conditions — they are here so you don't have to run a correction later:
- ✅ Please write "in this set of answers" or "in first attempts at quiz questions". Every figure on this page is an observed value within this dataset.
- ❌ Don't turn it into "Taiwanese learners do X". The sample is people who chose to practise on this site; it represents no wider population.
- ❌ Don't compare the difficulty of JLPT levels. The levels draw on different question sets, there is no IRT equating, and the confidence intervals for N3 and N2 overlap — this data cannot separate them.
- ❌ Don't phrase it causally. The data can say "observed together"; it cannot say "because".
If you are unsure whether a particular phrasing holds up, just ask us — far cheaper than a correction after publication.
Attributable quotes
Both quotes below may be used directly, without asking.
"On first attempts at quiz questions, 92.1% on vocabulary versus 53.7% on grammar patterns. This only describes people who chose to practise on our site; it doesn't generalise to learners at large. But if you're stuck at 'I know the words, I just can't build the sentence', you're not alone in that."
— Founder, Nihongo to Japan
"On the same data, changing only which answers you count moves grammar-pattern accuracy from 53.7% to 85.4%. We publish all four definitions side by side, because a single headline number gives the reader no way to tell which one they're looking at."
— Founder, Nihongo to Japan
There is no research team and no press officer. The quotes above are attributed to the person who actually built this dataset; for a response to a specific question, please use the contact section.
For researchers and educators
Structure: one row per aggregate cell, indexed by dimension (axis / jlpt / knowledge_point / axis_x_jlpt) × analysis_set (quiz_first_attempt / lesson_first_attempt / first_attempt / all_events). Each cell reports n, learners, accuracy, Wilson ci95_low/ci95_high and a flag. The JSON additionally carries the analysis-set decomposition, the paired comparison and the weighting effect.
Sampling: self-selected and observational; the unit of analysis is the answer event; a learner identifier is an anonymous UUID, so the identifier count is an upper bound on the number of people (the same person on two devices produces two identifiers, and identifiers cannot be linked).
Known methodological gaps — we think these are worth stating rather than hiding:
- No IRT difficulty equating and no cross-level anchor items, so between-level comparisons do not hold.
- The lesson and quiz contexts draw on almost disjoint question sets (only 6 of 5,772 grammar-pattern questions overlap), so context effects and item difficulty cannot be separated.
- The hint / explanation / answer-key fields are never written, so those behaviours are unobservable. They cannot be used as analysis conditions and their absence cannot be read as "it did not happen".
- Response time is null for 94% of events, so no speed–accuracy trade-off analysis and no filtering of implausibly fast answers.
- No demographic variables (age, first language, years of study, country), so no stratified analysis is possible. The dataset has no first-language field and no geography field, so this report makes no inference about learners' native language or location.
- A 12-day window, so no learning curves and no retention analysis.
- Learner-level data is not published (aggregates only), so multilevel models cannot be refitted externally. If that matters for your research, please get in touch.
Download JSON · Download CSV · Citation formats · Full methodology
Media and data contact
Founder, Nihongo to Japan · Email: [email protected]
Happy to answer: methodology details, re-checks of any aggregate figure, requests to reproduce the charts, the limits of what this data supports, and whether the dataset can answer a specific question. Replies usually within 2–3 working days; requests from media for publication-ready images are a fast lane, answered within 24 hours (see the press kit).
The site is run independently by a solo developer in Taiwan. There is no research team and no press officer — the address above reaches the person who actually built this dataset, not a front desk. It is stated here because anyone citing the data is entitled to know who is behind it.
Versions and changelog
This URL always points to the most recent snapshot. Every release carries a version number and a freeze date, so please include the version when citing (for example: v1.1.0, snapshot 2026-08-14) — when the figures are later updated, the version you cited remains identifiable. The JSON and CSV downloads carry the same version fields.
| Version | Snapshot frozen | Coverage | Notes |
|---|---|---|---|
| v1.1.0 | 2026-08-14 | 2–13 August 2026 (12 days) | First public release. Primary analysis set: quiz-context first attempts; all four analysis sets published side by side. |
The next release is expected after roughly three months of additional data, which is the earliest point at which any trend could be discussed. Updating the data will not rewrite the figures of an already published version: a new release gets a new version number and a new freeze date, and the earlier figures stay identifiable by their version. If you have already cited a version and its figures change, write to us and we will tell you exactly what differs.
← Back to Research & Data | How Taiwan Learns Japanese 2026 | For educators & libraries