Japanese Learning Answer Dataset — October 2026
In one sentence: aggregate statistics from 543,344 anonymous answer events on Nihongo to Japan, covering 2 August – 21 October 2026 (81 days) and 25,850 questions — 9.6 times the volume of the August release (v1.1.0).
⚠️ v2 and v1 use different analysis sets. Do not subtract one release's accuracy from the other's. v1 was computed directly from the database, with "first attempts in quiz context" as its primary set. v2 deliberately uses only public aggregate endpoints that anyone can query (/api/aggregates,/api/community), so its primary measures are "all answers" and "item-level first attempts, one vote per question". The upside is reproducibility: the sha256 of every input file is recorded in the download, so outside researchers can verify exactly which data we used. See Methodology.
What this dataset is not. It is not a representative survey of Japanese learners. The sample is people who chose to practise on this website — a self-selected, observational sample. Every figure describes what happened in NTJ's answer log only; none generalises to a population, and none is a causal claim. See Limitations.
Ten quotable findings
Each item is self-contained: it names the dataset, period, sample size and analysis set, so it can be quoted on its own. Please cite the limitations alongside.
- The NTJ Japanese Learning Answer Dataset (October 2026, v2.0.0) contains 543,344 anonymous answer events on 25,850 questions recorded between 2 August and 21 October 2026 — 9.6 times the 56,613 events in the site's August 2026 release.
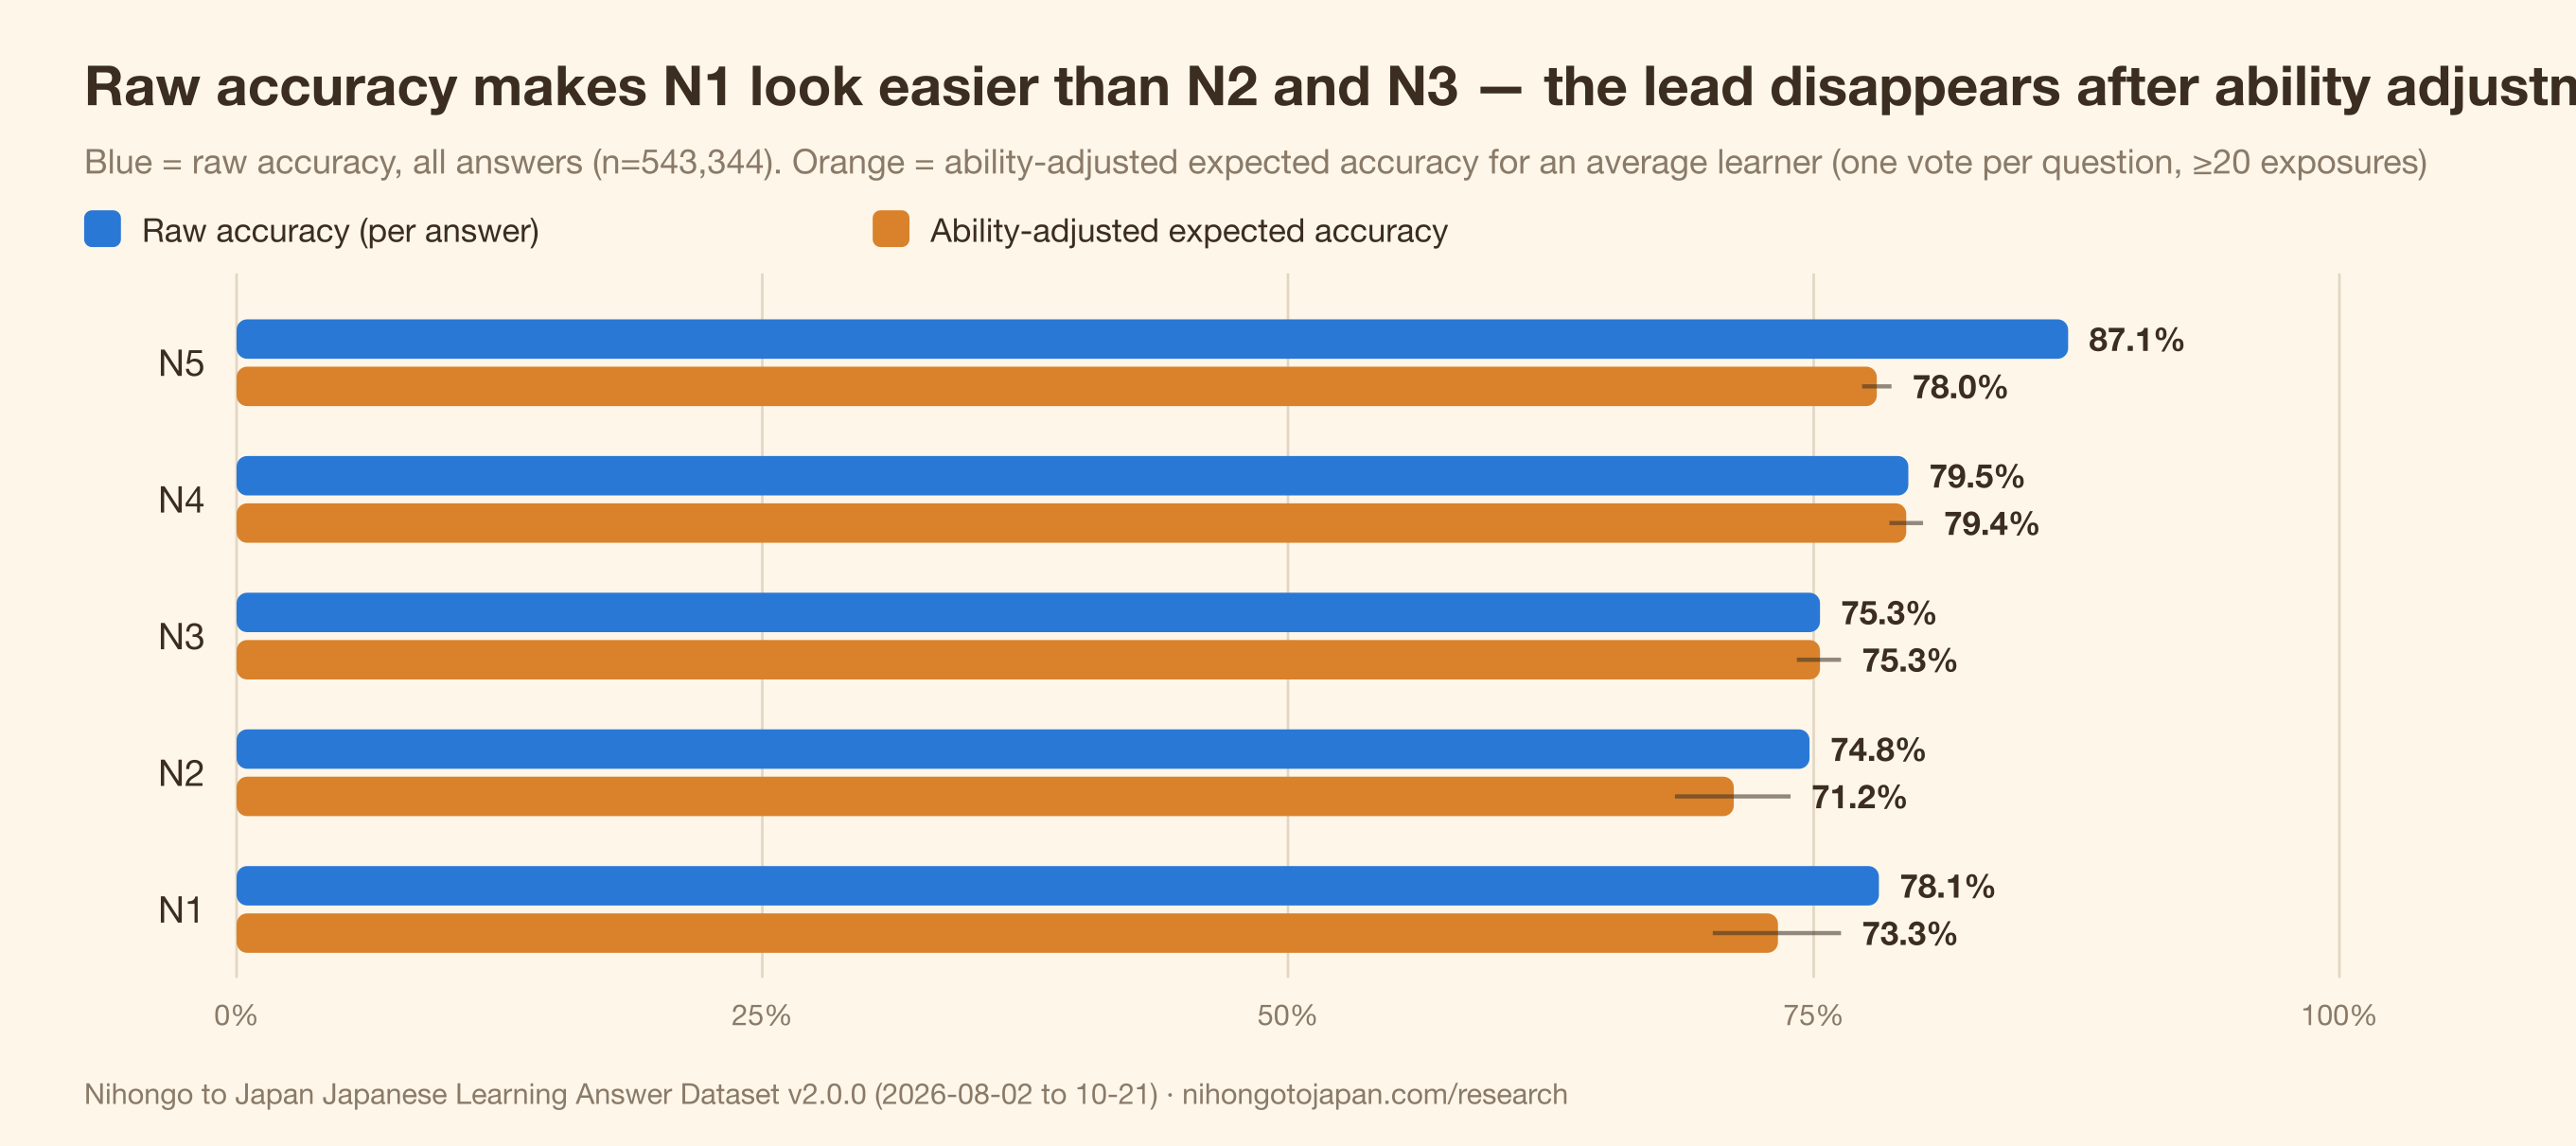
- Across all answers in the same dataset, raw accuracy by JLPT level is N5 87.1%, N4 79.5%, N3 75.3%, N2 74.8% and N1 78.1% (n=33,082) — N1 scores higher than both N2 and N3.
- After removing learner ability with a one-step Rasch estimate (one vote per question, ≥20 exposures), the expected accuracy for an average learner is N3 75.3% (95% CI 74.2–76.3%, 847 questions), N1 73.3% (70.2–76.3%, 210 questions) and N2 71.2% (68.4–73.9%, 204 questions). N1's lead over N3 disappears, consistent with a selection effect in which stronger learners are the ones who attempt N1 questions.
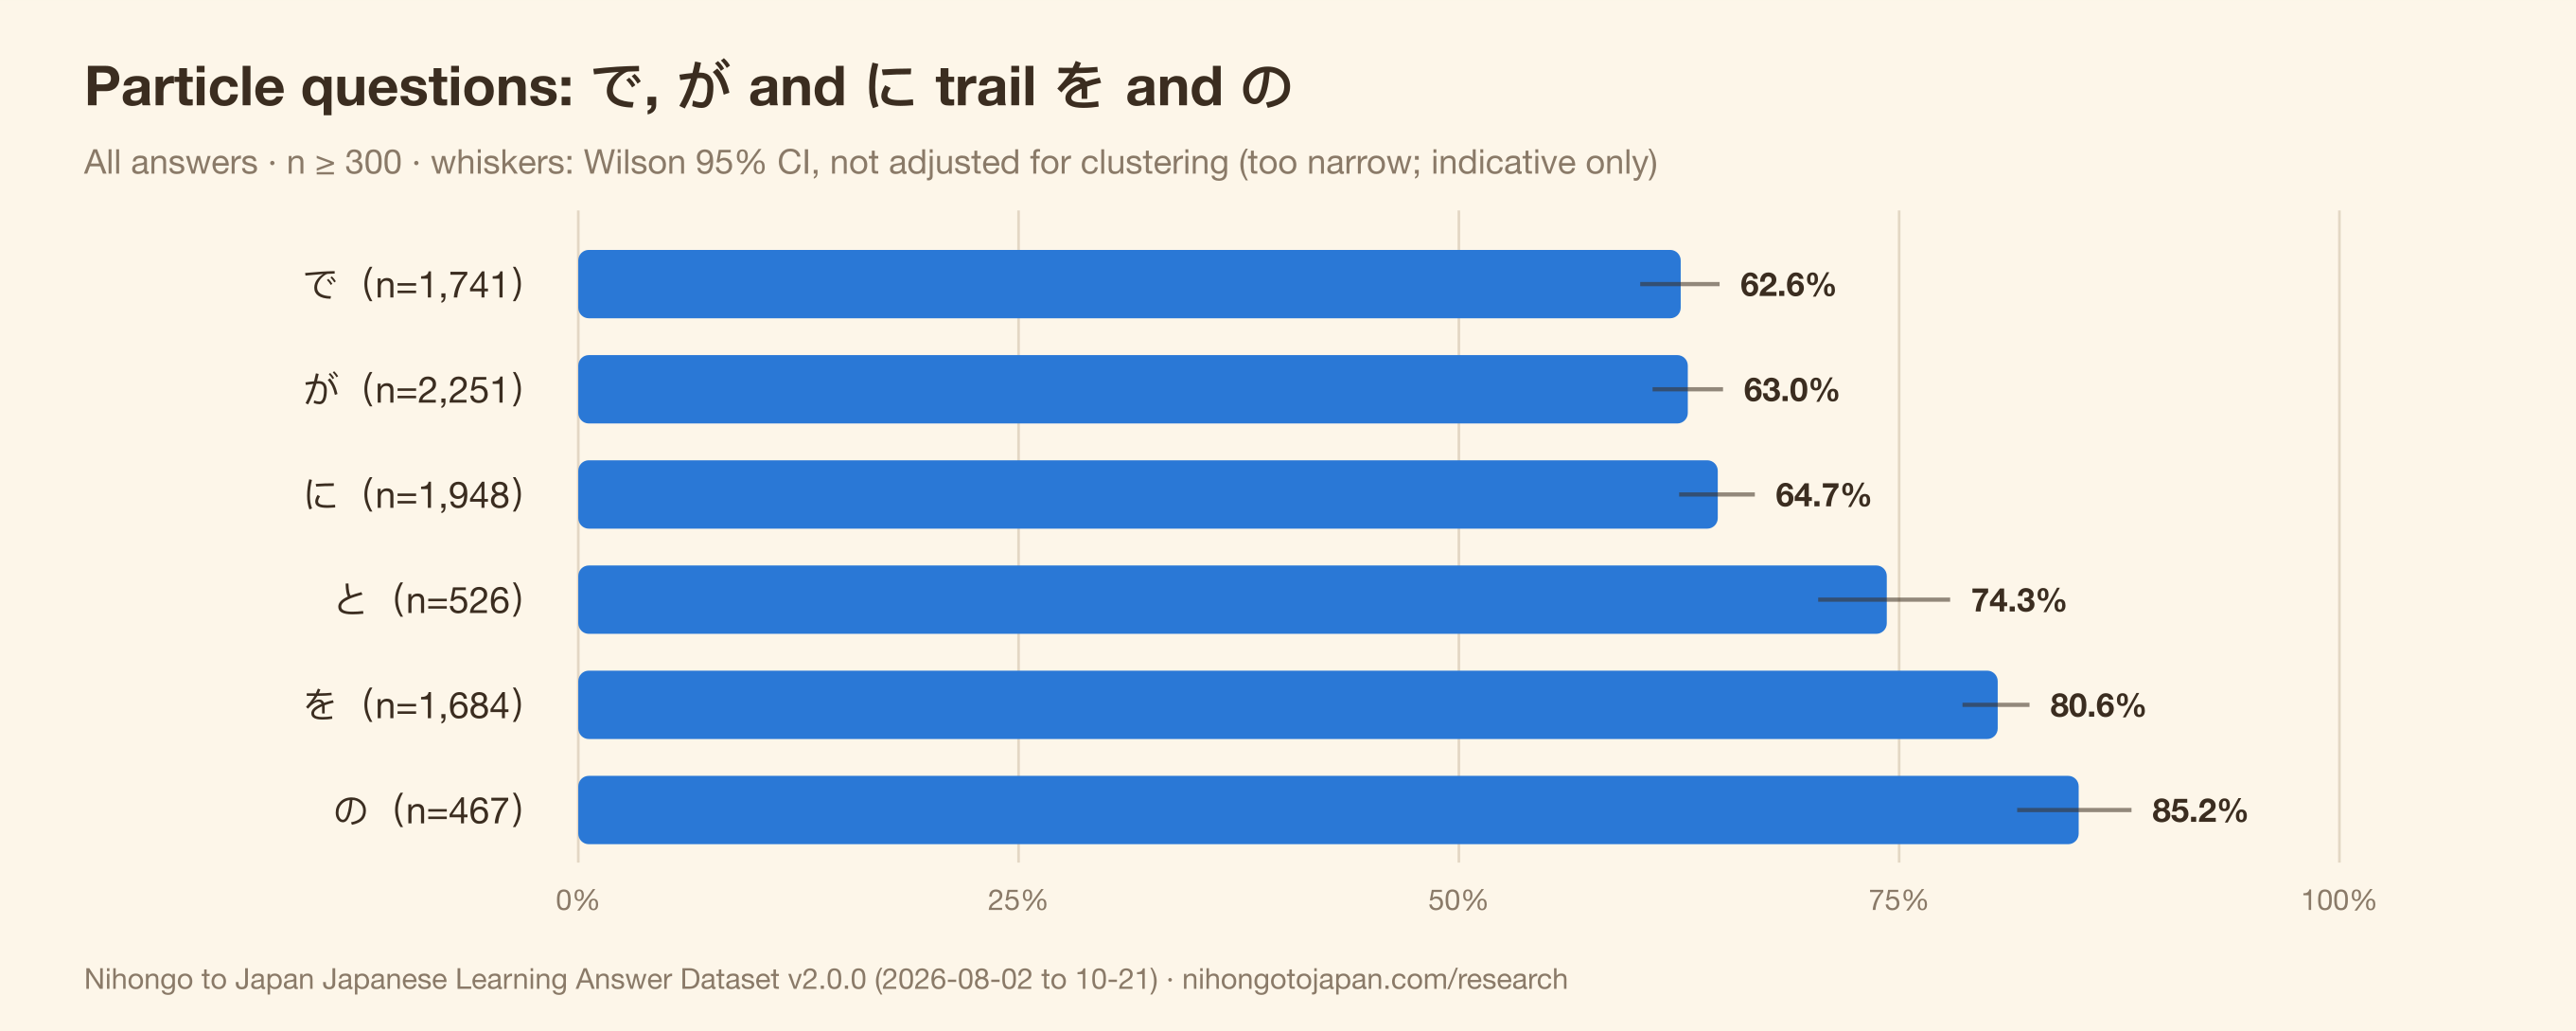
The adjusted N1 and N3 intervals overlap, so this does not show N1 is harder than N3 — only that the raw ordering cannot be trusted. - Across all answers, the lowest-accuracy particles are で 62.6% (n=1,741), が 63.0% (n=2,251) and に 64.7% (n=1,948); the highest are を 80.6% (n=1,684) and の 85.2% (n=467) — a 22.6-point gap between で and の.
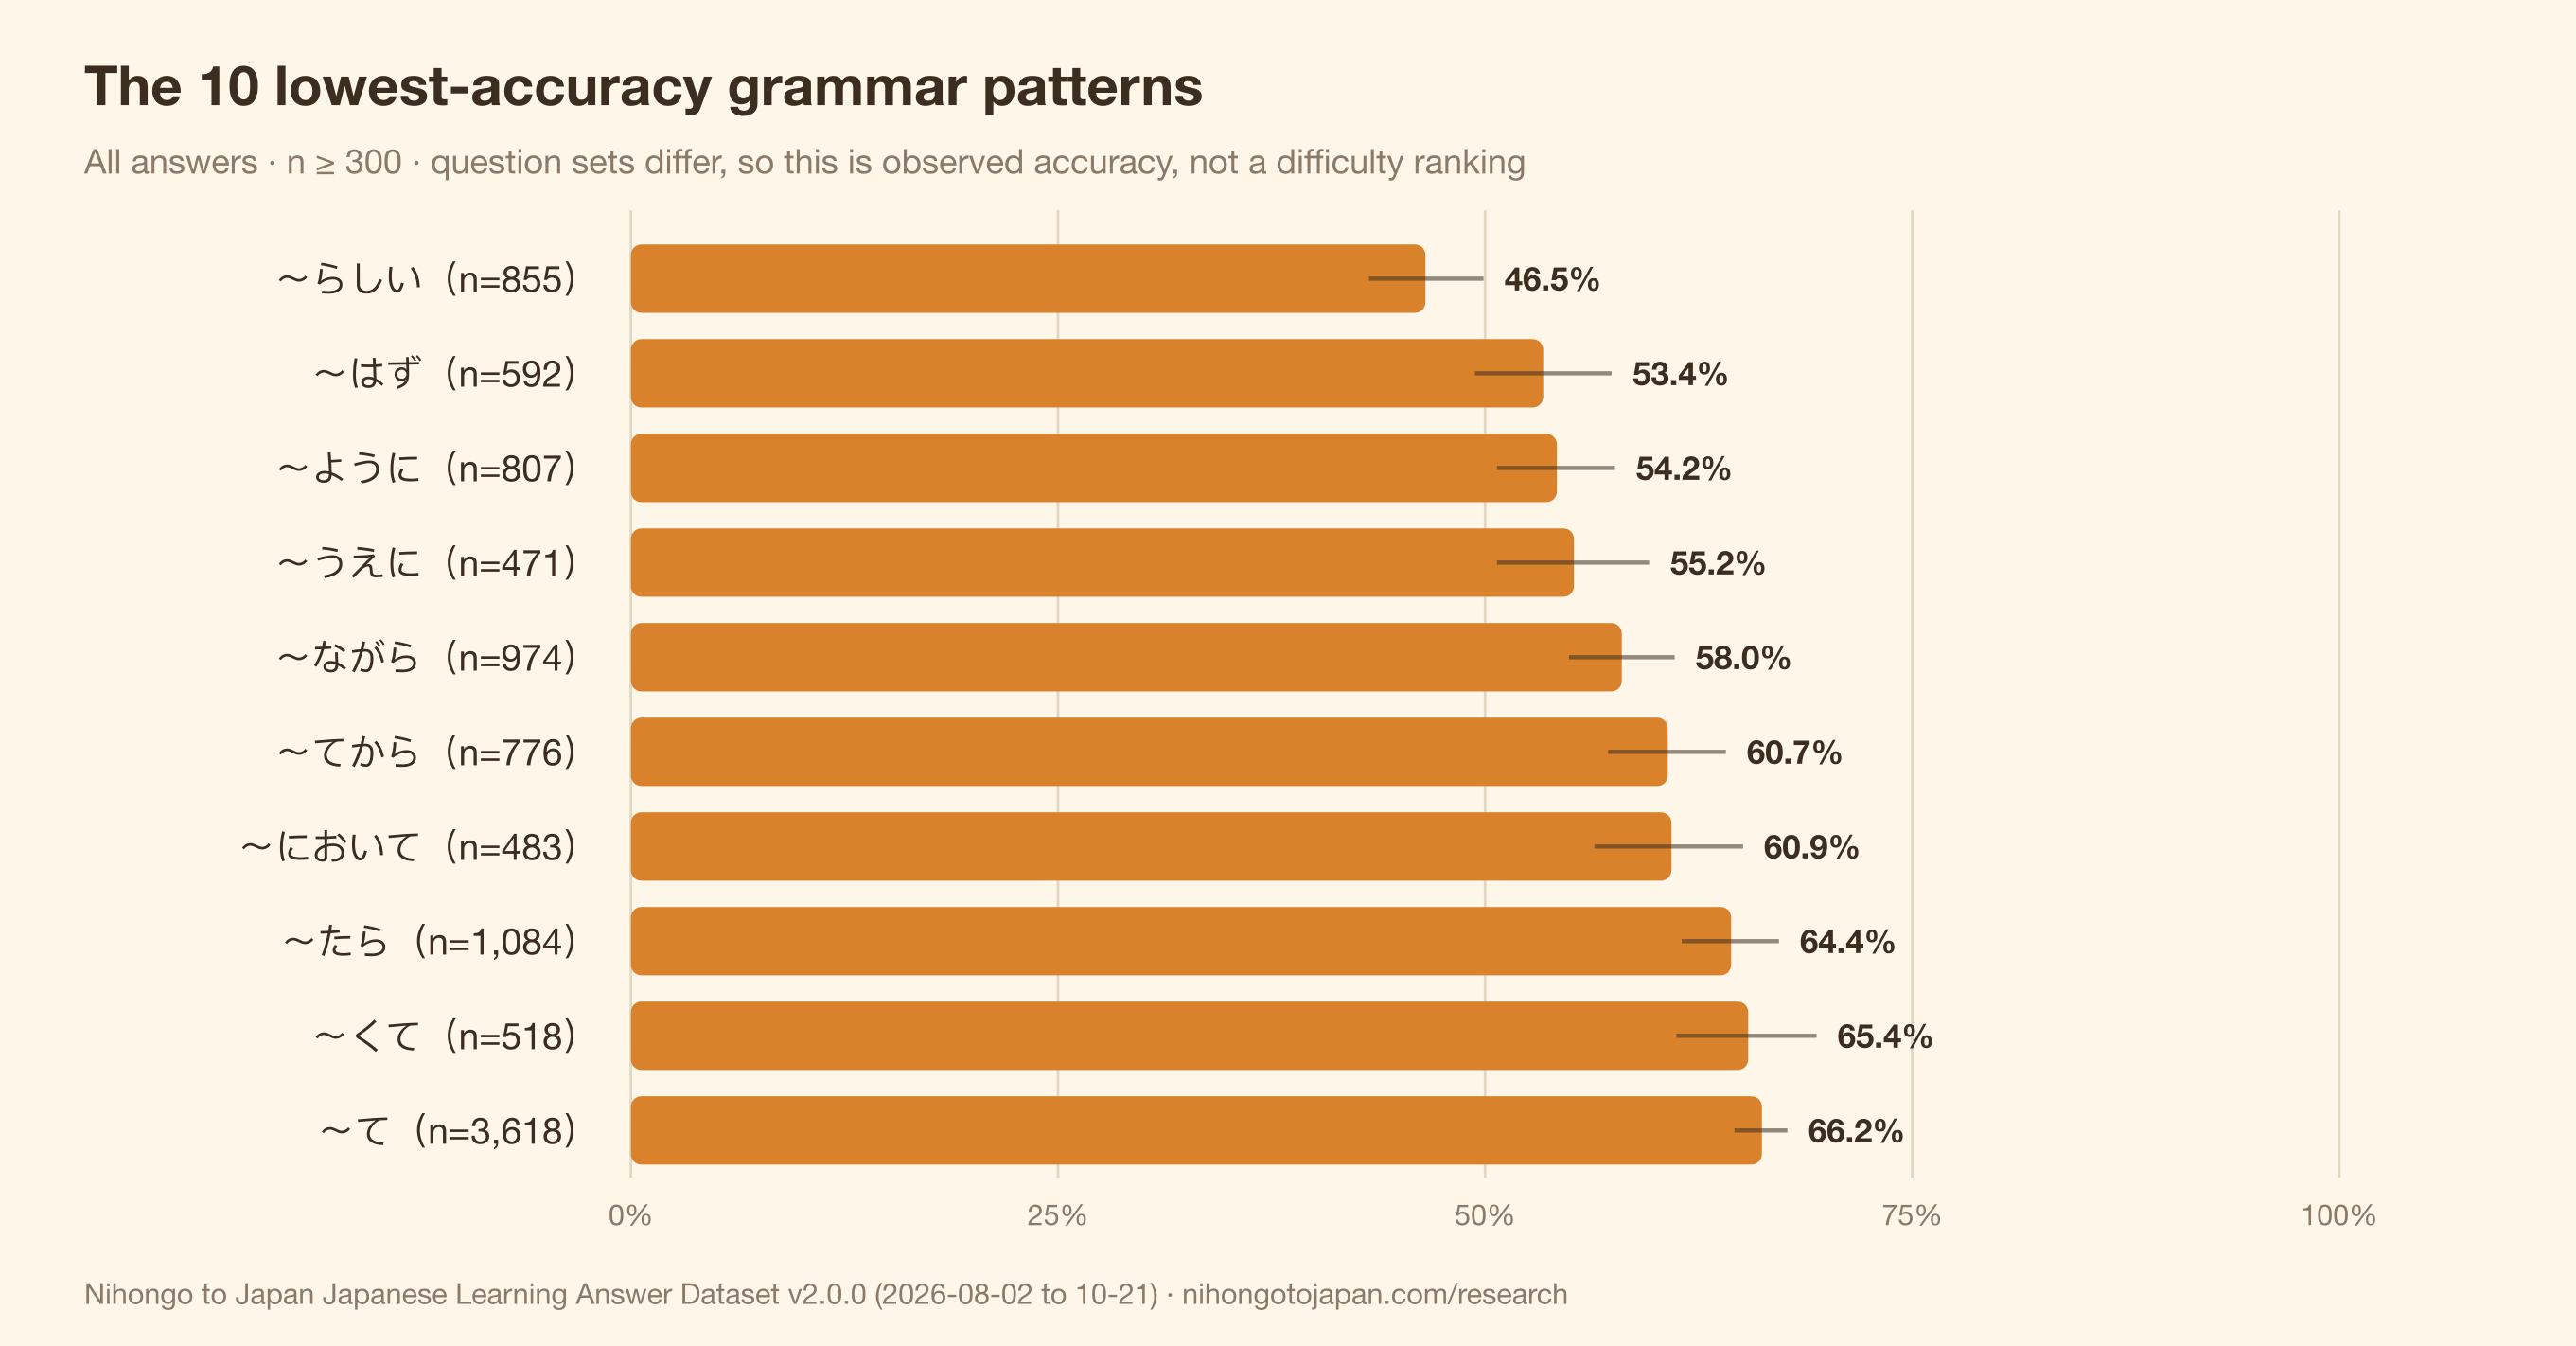
- Among grammar patterns with n ≥ 300, the lowest all-answer accuracy is for 〜らしい 46.5% (n=855), followed by 〜はず 53.4% (n=592), 〜ように 54.2% (n=807), 〜うえに 55.2% (n=471) and 〜ながら 58.0% (n=974).
- Among verb-form questions, the potential form scores lowest at 64.5% (n=1,923) and the ます-form highest at 84.0% (n=2,270), with た-form 70.7%, て-form 74.1% and ない-form 75.0% in between.
- Counting one vote per question (7,057 questions with ≥20 exposures), mean first-attempt accuracy is 89.1% for vocabulary (95% CI 88.7–89.5%), 73.9% for grammar patterns (73.1–74.7%) and 67.6% for particles (64.9–70.4%).
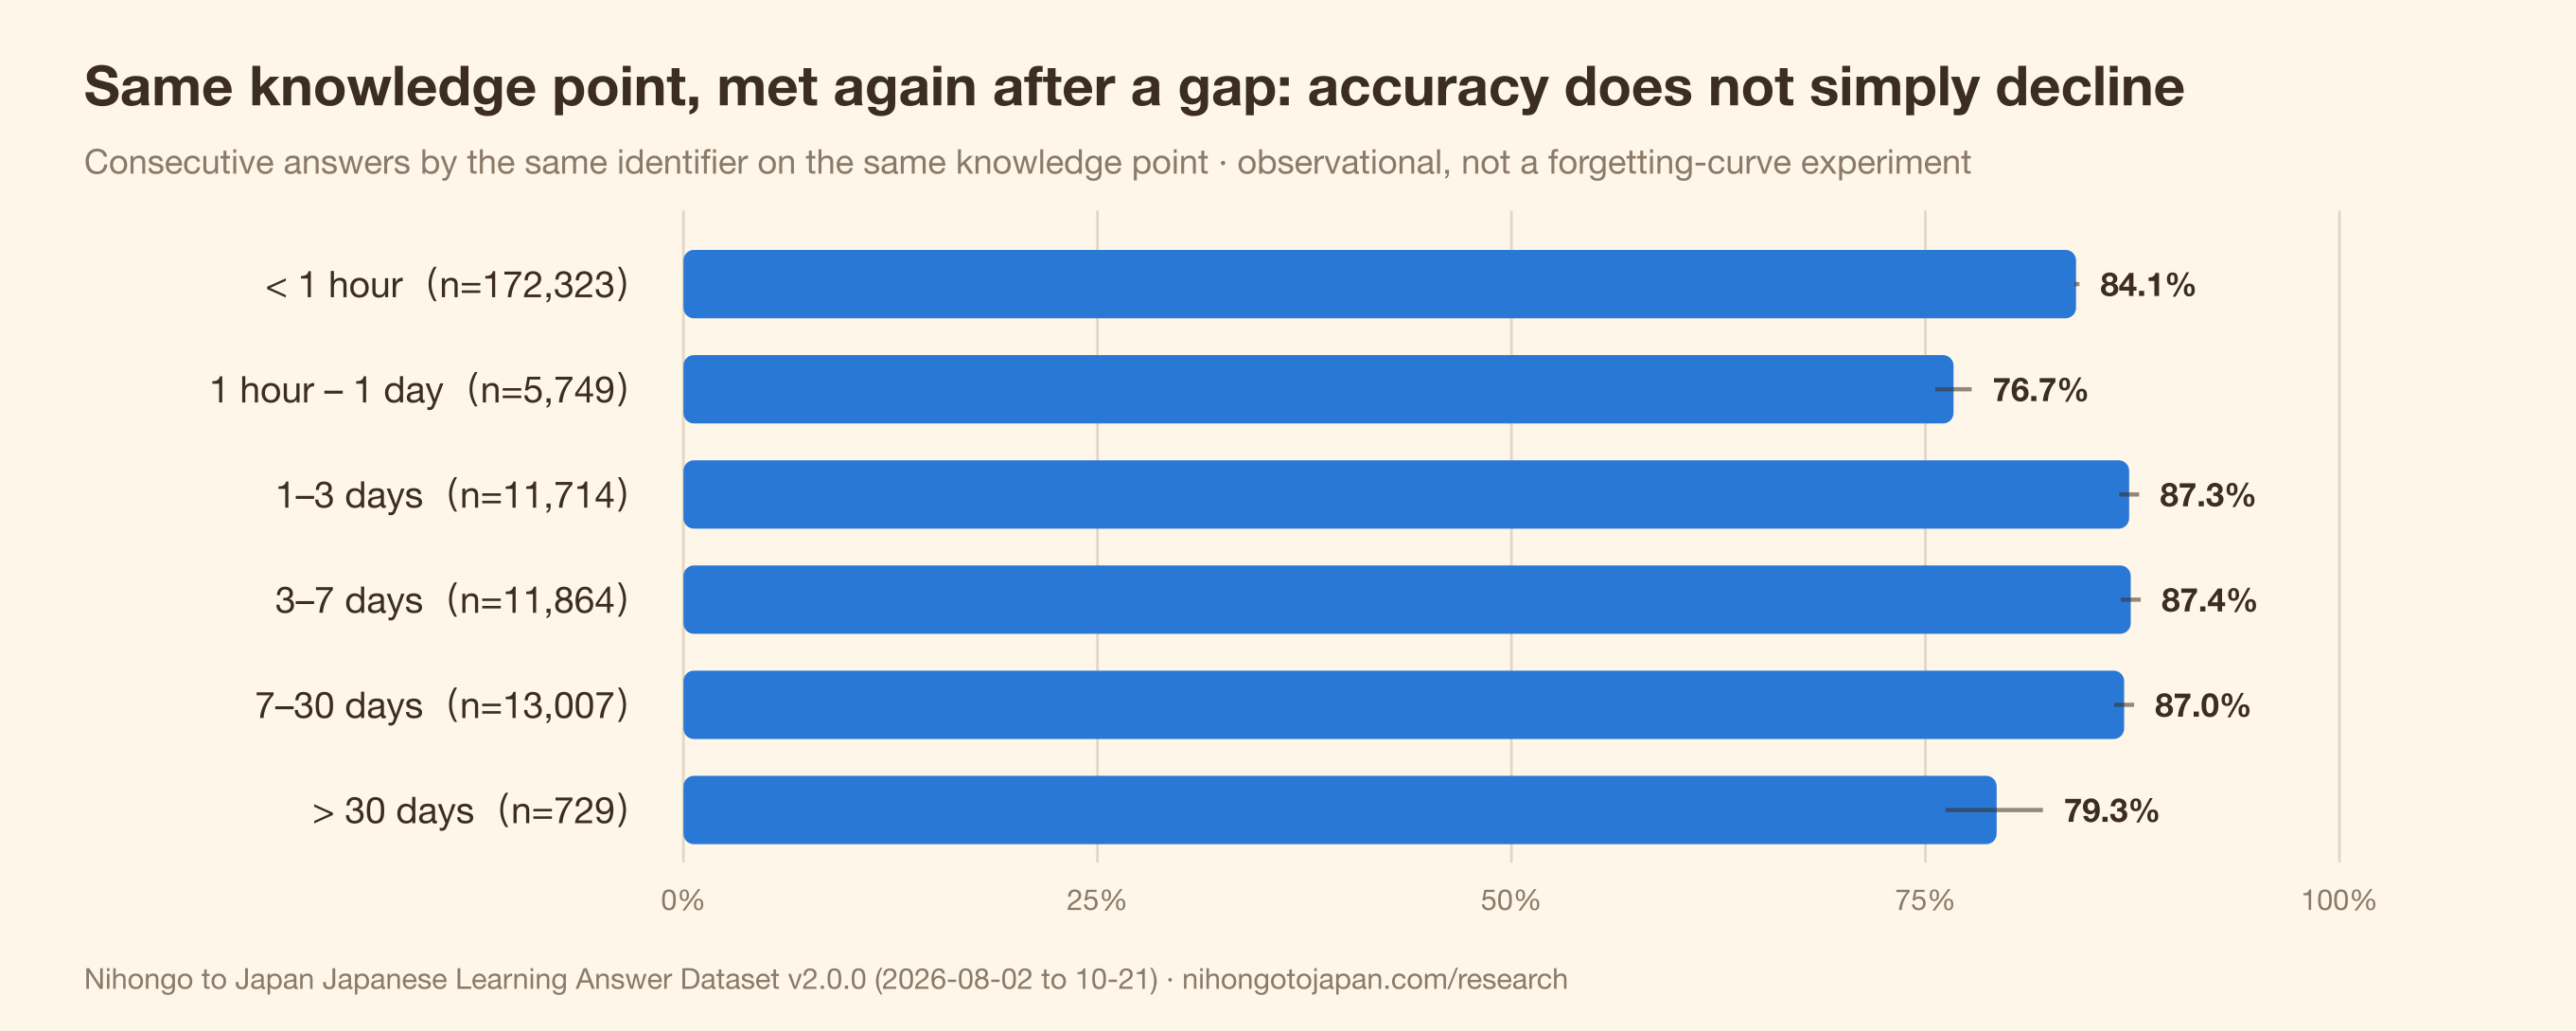
- For consecutive answers by the same identifier on the same knowledge point, accuracy is 84.1% when the gap is under an hour, 76.7% at 1 hour – 1 day, 87.0–87.4% at 1–3, 3–7 and 7–30 days, and 79.3% beyond 30 days (n=729). Accuracy does not decline monotonically with the gap.
This is observational: who returns after a few days is not random. It does not show that reviewing after a few days works best. - Of 7,057 questions with ≥20 exposures, 283 (4.0%) have first-attempt accuracy below 35% (random guessing on four options is about 25%). A common cause is a second defensible option; these questions are in a manual review queue.
- The site's answer-prediction model v2 scores a Brier score of 0.199 on 257,010 answers, 51.4% lower than v1's 0.409 — but still worse than the 0.161 of a constant baseline that always predicts the overall accuracy of 79.9%. Only the version that adds item-level difficulty (0.130) beats the baseline.
1. Five main findings
1. "N1 is easier than N3" is an illusion created by selection
On raw all-answer accuracy, N1 (78.1%) beats N3 (75.3%) and N2 (74.8%). That makes little sense, and v1 saw the same thing. The most likely explanation is who answers: people who click into N1 questions are already stronger.
v2 recomputes with ability-adjusted difficulty: each question's observed result is corrected for the average ability of the people who actually answered it, then expressed as the probability that an average learner gets it right. After adjustment, N1's lead disappears (N3 75.3%, N1 73.3%, N2 71.2%).
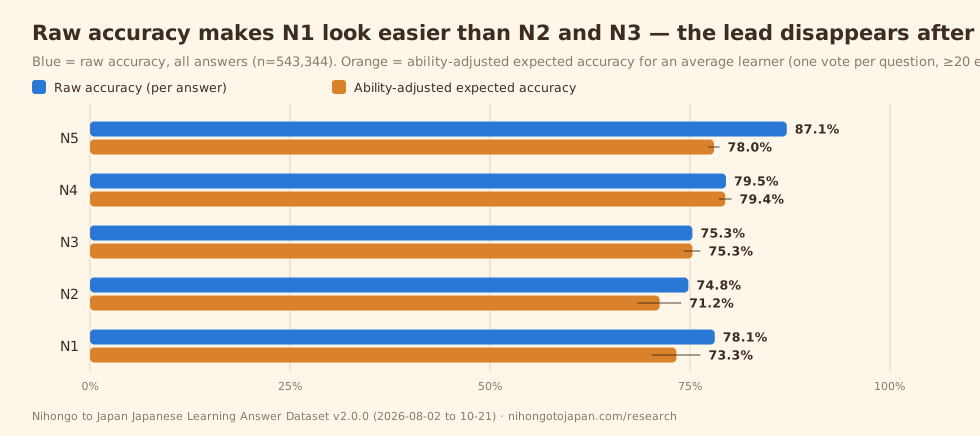
Two caveats. First, the adjusted N1 and N3 intervals still overlap, so we cannot say N1 is harder than N3. Second, adjusted N5 (78.0%) is not above N4 (79.4%): the adjustment handles who answers, not which questions each level contains — 53% of the N5 questions in the analysis are grammar patterns versus 33% at N4, and pattern questions are harder to get right than vocabulary.
2. The particle gap: で, が and に trail を and の by about 20 points
で (62.6%), が (63.0%) and に (64.7%) sit nearly 20 points below を (80.6%) and の (85.2%). What the low three share is one particle, many uses: で marks place, means, cause and scope; に marks time, destination, recipient and purpose.
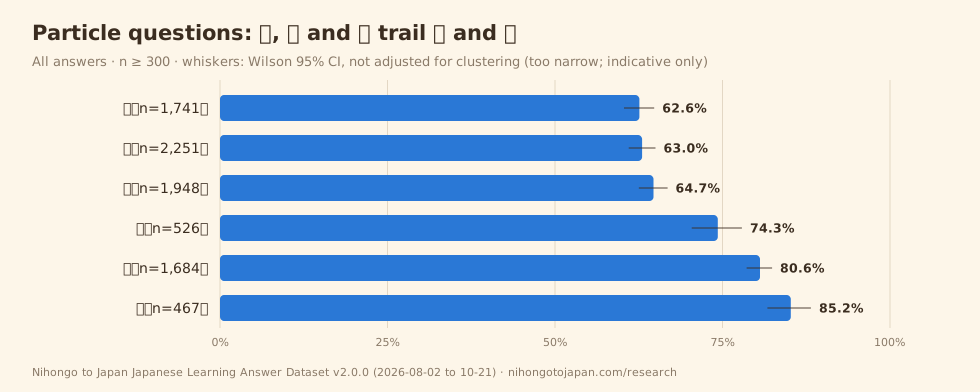
This matches v1 ("the gap within particles is larger than the gap between levels"), and v2's larger sample makes the direction more stable.
3. The hardest patterns cluster around inference and purpose/state
Of the five lowest patterns, 〜らしい (46.5%) and 〜はず (53.4%) both express inference or expectation and are easily confused with 〜そう, 〜よう and 〜みたい; 〜ように (54.2%) covers purpose, change and requests; 〜ながら (58.0%) is often mixed up with 〜て and 〜まま.
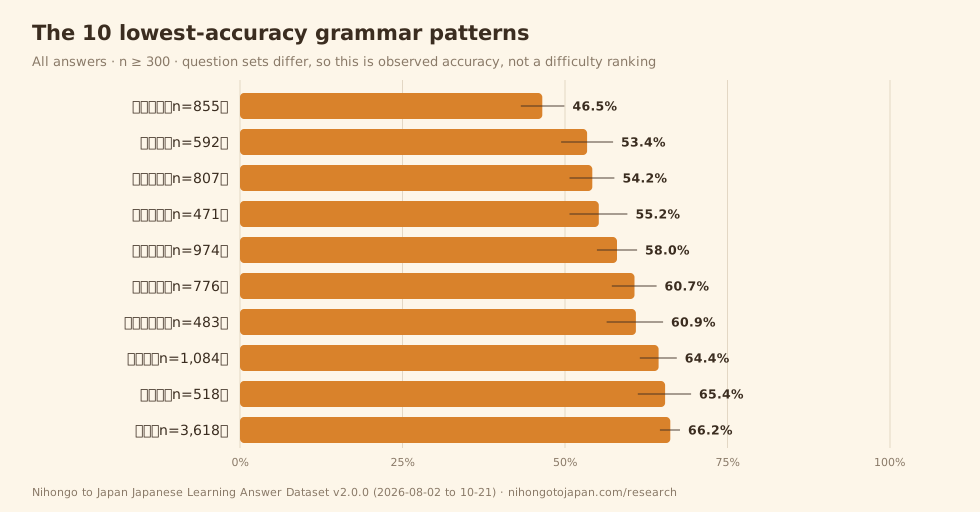
Verb forms show a similar structure: the potential form (64.5%) is the lowest of five. Its rules differ for ichidan, godan and irregular verbs, and learners also meet colloquial ら-dropping variants.
4. Accuracy after a gap does not simply decline
Pairing consecutive answers by the same identifier on the same knowledge point, grouped by gap:
| Gap | Answers | Identifiers | Accuracy |
|---|---|---|---|
| < 1 hour | 172,323 | 3,472 | 84.1% |
| 1 hour – 1 day | 5,749 | 647 | 76.7% |
| 1–3 days | 11,714 | 532 | 87.3% |
| 3–7 days | 11,864 | 449 | 87.4% |
| 7–30 days | 13,007 | 405 | 87.0% |
| > 30 days | 729 | 126 | 79.3% |
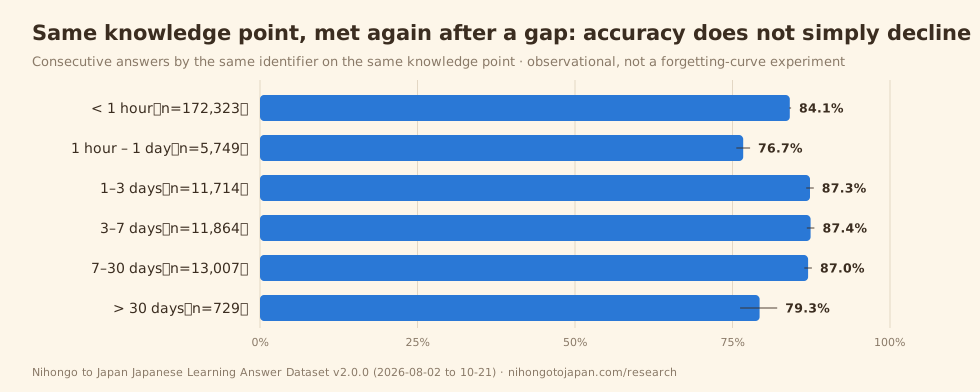
The textbook forgetting curve says longer gaps mean more forgetting. Here, 1 hour – 1 day is lowest and 1–30 days highest. We do not read this as "reviewing after a few days works best": who comes back after a few days is not random — returning learners are more engaged and possibly stronger. The 1 hour – 1 day group has only 647 identifiers and may include people redoing a set on a second device the same day. Answering the spacing question needs a randomised experiment, which this dataset cannot provide.
5. The prediction model halved its error but has not beaten the simplest baseline
The site's question recommender first predicts the probability that you will answer correctly. We evaluate it with the Brier score (mean squared difference between predicted probability and outcome; lower is better):
- v1 model: 0.409
- v2 model: 0.199 (51.4% lower)
- v2 with item-level difficulty: 0.130 (68.1% lower)
- Reference: a constant baseline that always predicts the overall 79.9%: 0.161
v2 halves v1's error but still loses to the constant baseline overall; only adding item-level difficulty beats it. We publish this because it shows directly that the difficulty of the question predicts correctness better than the learner's level does — which is also why finding 1 needs ability adjustment.
2. Dataset overview
| Item | Value | Notes |
|---|---|---|
| Valid answer events | 543,344 | Aggregate snapshot 2026-10-21 19:18 UTC, all_clean_events scope (site cleaning rules applied) |
| Learner identifiers (≥1 grade-A answer) | 5,410 | totalUsers in the aggregate endpoint |
| Learner identifiers (all) | 8,073 | Community endpoint; an upper bound on people |
| Questions answered | 25,850 | 7,057 with ≥20 exposures enter the item-level analysis |
| Questions with adjusted difficulty | 18,139 | One-step Rasch estimate with empirical-Bayes shrinkage |
| Evidence grade | A 59.8% · B 33.5% · C 6.7% | A = quiz context; B = lesson practice; C = other (as in v1) |
| Coverage | 2026-08-02 to 10-21 | 81 days |
About the live counter: the home page's "NTJ learners have completed 552,850 practice answers" is the community endpoint's live figure on 2026-10-23, about 9,500 higher than this dataset — the answers added in the two days after the snapshot. Cite 543,344.
3. Skill axes (all answers)
| Axis | Answers | Accuracy | Item-level first attempt (questions) |
|---|---|---|---|
| Vocabulary | 267,127 | 90.1% | 89.1% (3,398) |
| Grammar patterns | 234,602 | 75.2% | 73.9% (3,252) |
| Verb forms | 18,479 | 75.2% | 76.2% (154) |
| Particles | 13,870 | 71.3% | 67.6% (189) |
| Idioms | 7,413 | 88.1% | 92.4% (64) |
| Reading | 1,103 | 78.7% | — |
| Listening | 605 | 69.8% | — |
| Speaking | 118 | SUPPRESSED | — |
Reading, listening and speaking are newer question types with small samples; speaking is below the 300-answer threshold, so only its count is reported.
4. JLPT levels
| Level | All-answer accuracy (n) | Item-level first attempt (questions) | Ability-adjusted expected accuracy (95% CI) |
|---|---|---|---|
| N5 | 87.1% (297,809) | 82.6% (3,817) | 78.0% (77.3–78.7%) |
| N4 | 79.5% (93,609) | 84.5% (1,766) | 79.4% (78.6–80.2%) |
| N3 | 75.3% (82,010) | 75.7% (1,008) | 75.3% (74.2–76.3%) |
| N2 | 74.8% (36,837) | 66.9% (249) | 71.2% (68.4–73.9%) |
| N1 | 78.1% (33,082) | 74.2% (217) | 73.3% (70.2–76.3%) |
The three columns use different analysis sets; compare within a column, not across. Column 1 counts every answer, including repeats, and depends on each level's mix of question types; column 2 gives each question one vote; column 3 additionally removes learner ability.
5. Item quality: our own question bank is measured too
| First-attempt accuracy | Questions |
|---|---|
| < 35% | 283 |
| 35–50% | 377 |
| 50–70% | 971 |
| 70–85% | 1,347 |
| 85–95% | 1,937 |
| ≥ 95% | 2,142 |
The 283 questions (4.0%) below 35% are not necessarily bad — some are simply hard. But our August manual review found this band often contains a second defensible option (for example, both が and を work in 「ピアノ_弾けます」). The system also flags 415 questions for review using criteria such as clearly negative discrimination. That flag's precision is about 0.19: it is a review queue, not a list of bad questions.
6. How teachers and materials designers can use this
- Particles: で, が and に trail を and の by about 20 points. Practising one use at a time with its own examples is more targeted than drilling a particle as a whole.
- Inference expressions: 〜らしい and 〜はず are the most frequently missed patterns here; contrast them with 〜そう, 〜よう and 〜みたい.
- Potential form: the lowest of five verb forms; practise it separately by verb class.
- Reading your own data: if your platform also shows advanced questions scoring higher than intermediate ones, suspect selection before you suspect the questions.
7. Methodology
Sources and reproducibility
Every figure in v2 comes from six public endpoints, retrieved and frozen on 2026-10-23: /api/aggregates?kind=summary, kind=items, kind=difficulty, kind=spacing, kind=brier and /api/community?kind=overview. Each endpoint's snapshot time and each input file's sha256 are in the JSON download under dataset.source_snapshot_at_utc and dataset.input_sha256. The build script, scripts/build-research-dataset-2026-10.py, has no access to learner-level data.
Five analysis sets
- All answers (axes, levels, knowledge points): every valid answer counts, including repeats by the same identifier.
- Item-level first attempts: for each question, accuracy of each identifier's first attempt, then averaged across questions. Only questions with ≥20 exposures; 95% CIs use the question as the unit.
- Ability-adjusted difficulty: one-step Rasch estimate b̂ = θ̄ (mean ability of actual answerers) − logit(p̂), shrunk towards the axis mean with weight n/(n+5), converted to the expected error rate for a learner of average site-wide ability. We report 1 − expected error.
- Consecutive-answer pairs (spacing): consecutive answers by the same identifier on the same knowledge point, evidence grades A and B only.
- Prediction accuracy: all grade-A answers carrying both v1 and v2 predictions (prediction fields exist from 2026-08-20).
Minimum cell sizes
Event-level cells with n < 300 are suppressed; knowledge points are listed only at n ≥ 300; item-level analyses include only questions with ≥20 exposures.
Confidence intervals
Event-level Wilson 95% CIs are not adjusted for repeated answers by the same identifier (the public endpoints do not expose identifier-level data), so they are too narrow and indicative only. Item-level CIs treat the question as the sampling unit: they describe this question bank, not a learner population.
Anonymity
The public endpoints return aggregates only. This dataset contains no raw answer events, no identifiers and no event-level timestamps.
8. Limitations (please cite with the figures)
- Self-selected observational sample of people who practise on NTJ; not representative of any learner population.
- Identifiers are not people: anonymous browser identifiers cannot be merged across devices; 8,073 is an upper bound.
- Different question sets: levels, axes and knowledge points use different questions, so accuracy gaps are not difficulty rankings.
- All-answer figures are inflated by repeated practice.
- Ability adjustment has assumptions: the Rasch model assumes a single ability dimension; ability is estimated only for identifiers with enough answers.
- Event-level CIs are too narrow (see Methodology).
- Item list truncation:
kind=itemsreturns at most 25,000 questions by descending exposure (of 25,850); the 850 missing are the least-exposed and do not affect the ≥20-exposure analysis. - Top 100 knowledge points only: the aggregate endpoint returns the 100 most-answered knowledge points.
- Response time is unusable: idle open tabs inflate the mean, so response time is not reported.
- No causal claims anywhere in this report.
9. How to cite
You are welcome to cite this dataset in papers, reports, teaching materials and news coverage. Please name the source, state the version and link back to this page.
APA (7th)
Nihongo to Japan. (2026). Japanese learning answer dataset — October 2026 (Version 2.0.0) [Data set]. https://www.nihongotojapan.com/research/japanese-learning-data-2026-10MLA (9th)
Nihongo to Japan. Japanese Learning Answer Dataset — October 2026. Version 2.0.0, 2026, https://www.nihongotojapan.com/research/japanese-learning-data-2026-10.BibTeX
@misc{ntj_jlad_2026_10,

  title = {Japanese Learning Answer Dataset --- October 2026},

  author = {{Nihongo to Japan}},

  year = {2026},

  version = {2.0.0},

  note = {Snapshot 2026-10-21; aggregate statistics from 543,344 anonymous answer events, 2 August -- 21 October 2026},

  url = {https://www.nihongotojapan.com/research/japanese-learning-data-2026-10}

}
Licence: the data is CC BY 4.0
The data in this dataset is released under Creative Commons Attribution 4.0 International (CC BY 4.0). You may copy, redistribute, adapt and build upon it, including commercially, provided you give appropriate credit and indicate if changes were made.
⚠️ The licence covers the data only: the aggregate figures on this page and the two downloadsjapanese-learning-2026-10.jsonandjapanese-learning-2026-10.csv. Our charts (SVG/PNG) and the report text are not covered; all rights reserved.
Attribution
Nihongo to Japan, Japanese Learning Answer Dataset — October 2026, v2.0.0, CC BY 4.0, https://www.nihongotojapan.com/research/japanese-learning-data-2026-10Our requests (not licence conditions)
- Carry the limitations: self-selected, observational, not representative.
- Name the analysis set: all answers, item-level first attempts and ability-adjusted figures differ a lot.
- Write "learner identifiers", not "people".
- State the version (v2.0.0, snapshot 2026-10-21).
⚠️ CC BY is irrevocable. Anyone who obtains the data under these terms keeps those rights even if we change our terms later.
10. Downloads
- japanese-learning-2026-10.json — full metadata, input sha256, thresholds and every aggregate cell.
- japanese-learning-2026-10.csv — one row per cell; columns
table, key, n, value, ci95_low, ci95_high, unit, note. - japanese-learning-2026-10-LICENSE.txt — licence statement.
Chart files (PNG at 2× resolution, scalable SVG; charts are not under CC BY — please contact us before reproducing one):
- Raw vs ability-adjusted accuracy: PNG · SVG
- Particle accuracy: PNG · SVG
- The 10 lowest-accuracy patterns: PNG · SVG
- Accuracy by review gap: PNG · SVG
Alt text for every chart is in alt-text.json.
Media and data contact
For finer breakdowns, suspected errors or questions about which figure to cite, email [email protected] with "Dataset v2.0.0" in the subject line.
Versions
| Version | Snapshot | Coverage | Notes |
|---|---|---|---|
| v2.0.0 | 2026-10-21 | 2026-08-02 to 10-21 (81 days) | This page. Built from public aggregate endpoints; adds ability-adjusted difficulty, spacing, item quality and prediction accuracy. |
| v1.1.0 | 2026-08-14 | 2026-08-02 to 08-13 (12 days) | First release; primary set "first attempts in quiz context". Its figures are unchanged and remain citable. |
Published figures are never rewritten. ← Research & Data | For educators & libraries